Chicago
Johnson, Vanessa M., Ivanny Jácome-Valladares, Claire Kenny, and
Tami Lasseter Clare. “VII. The Identification of Materials and
Processes Used in the Manufacture of Orotone, Hand-Colored
Orotone, and Silvertone Photographs.” In
Materia: Journal of Technical Art History (Issue
4), by Tetsuo Miyakoshi. San Diego: Materia, 2022.
https://netlify.app/essay_johnson-et-al/.
MLA
Johnson, Vanessa M., et al. “VII. The Identification of
Materials and Processes Used in the Manufacture of Orotone,
Hand-Colored Orotone, and Silvertone Photographs.”
Materia: Journal of Technical Art History (Issue
4), by Tetsuo Miyakoshi, Materia, 2022,
https://netlify.app/essay_johnson-et-al/. Accessed
DD Mon. YYYY.
VII.
The Identification of Materials and Processes Used in the
Manufacture of Orotone, Hand-Colored Orotone, and Silvertone
Photographs
Vanessa M. Johnson
Ivanny Jácome-Valladares
Claire Kenny
Tami Lasseter Clare
The Pacific Northwest Conservation Science Consortium and
the University of Washington (UW) Libraries have completed a
characterization study of the materials and processes used
in the creation of orotone and related silvertone
photographs. Popular during the early twentieth century,
particularly along the west coast of the United States,
orotone photographs are notable for their shimmering, golden
appearance. The photographic process utilized a positive
image on a clear glass plate with a subsequently applied
varnish and yellow metal flake layer.
Although the materials and processes used in the production
of orotones have been previously documented, there is
limited published scientific research on the subject. This
study expands on these findings by analyzing a broad
collection of photographs with a range of instrumental
techniques. Sixteen orotones, including six hand-colored
orotones, and two silvertones, all in good condition, from
the UW Libraries, as well as one orotone from the Portland
Art Museum (PAM) with significant image delamination, were
analyzed with the goal of increasing the body of knowledge
about these photographic types and providing additional
evidence of preservation needs.
Analysis of the metal flake using X-ray fluorescence (XRF)
spectroscopy identified copper and zinc alloys in all
orotones studied, while XRF coupled with scanning electron
microscopy/energy dispersive X-ray spectroscopy (SEM/EDS)
identified aluminum as the metal flake for one silvertone
photograph. From XRF spectroscopy, silver bromide was
determined to be the sensitizing salt used in the
photographic process while the gelatin emulsion layers
detected in all orotones indicated a gelatin dry plate was
used. Soda-lime-silica glass provided the image support in
all orotones, though small amounts of arsenic or lead were
detected in some of the glasses, which were likely added to
improve glass properties. Analysis of two hand-colored
orotones by XRF, micro-Fourier transform infrared (μFTIR),
and micro-Raman spectroscopies found vermilion, chromium
yellow, cadmium yellow, and Prussian blue. Two pigments were
not identified but are likely organic: one red and one blue;
the latter was mixed with cadmium yellow in a green area.
Analysis of orotones using pyrolysis/gas chromatography/mass
spectrometry (Py/GC/MS) and µFTIR spectroscopy identified
cellulose nitrate varnish layers. One orotone from the W
Libraries had been treated with an ethyl methacrylate /
methyl methacrylate copolymer, possibly Paraloid B72.
Determining the degree of substitution of the nitrate groups
suggested that this additional varnish layer accelerated the
degradation of the original cellulose nitrate varnish by
trapping acids and preventing migration of degradation
products. One orotone from the PAM contained only a
poly-butyl-methacrylate varnish and was found to be an
enlargement of another photograph. That finding indicates it
was likely produced after 1940, rather than on the assigned
date of 1903. The differences in swelling due to fluctuating
relative humidity likely accounts for the observed
delamination of the backing from the glass around the edges
of this orotone.
*This article has been approved for publication by peer
review.
Introduction
Popular from the late nineteenth century to the 1940s, the
orotone (also known as a Curt-tone, Doretype, and goldtone)
consisted of a positive photographic image developed on glass
and coated with a varnish modified by a yellow metal flake
that gave the image its characteristic brilliancy. A
silvertone was a photograph with the same layer structure as
an orotone but contained a white metal flake instead of a
yellow metal flake. The orotone photographic process was
popularized by Edward S. Curtis (1868–1952), whose orotones
served as a major source of income for his studio. Orotones
were primarily popular in the western United States and are
still somewhat rare in museum and library collections,1
making them a unique art form about which there is limited
available knowledge.
The aim of this project was to provide a broader understanding
of the materials and methods used in the production of orotone
photographs and to aid in considerations for their long-term
preservation and exhibition. The project focused on the
material analysis of the orotone collection at the University
of Washington (UW) Libraries by the Lasseter Clare Lab at
Portland State University within the Pacific Northwest
Conservation Science Consortium (PNWCSC). The PNWCSC is a
collaboration of five regional museums and the Lasseter Clare
Lab that provides scientific expertise and instrumentation to
consortium partners for research on a range of artistic and
historic works. Graduate students in the Clare Lab partner
with conservators and curators at these institutions to
explore conservation science questions and projects in a
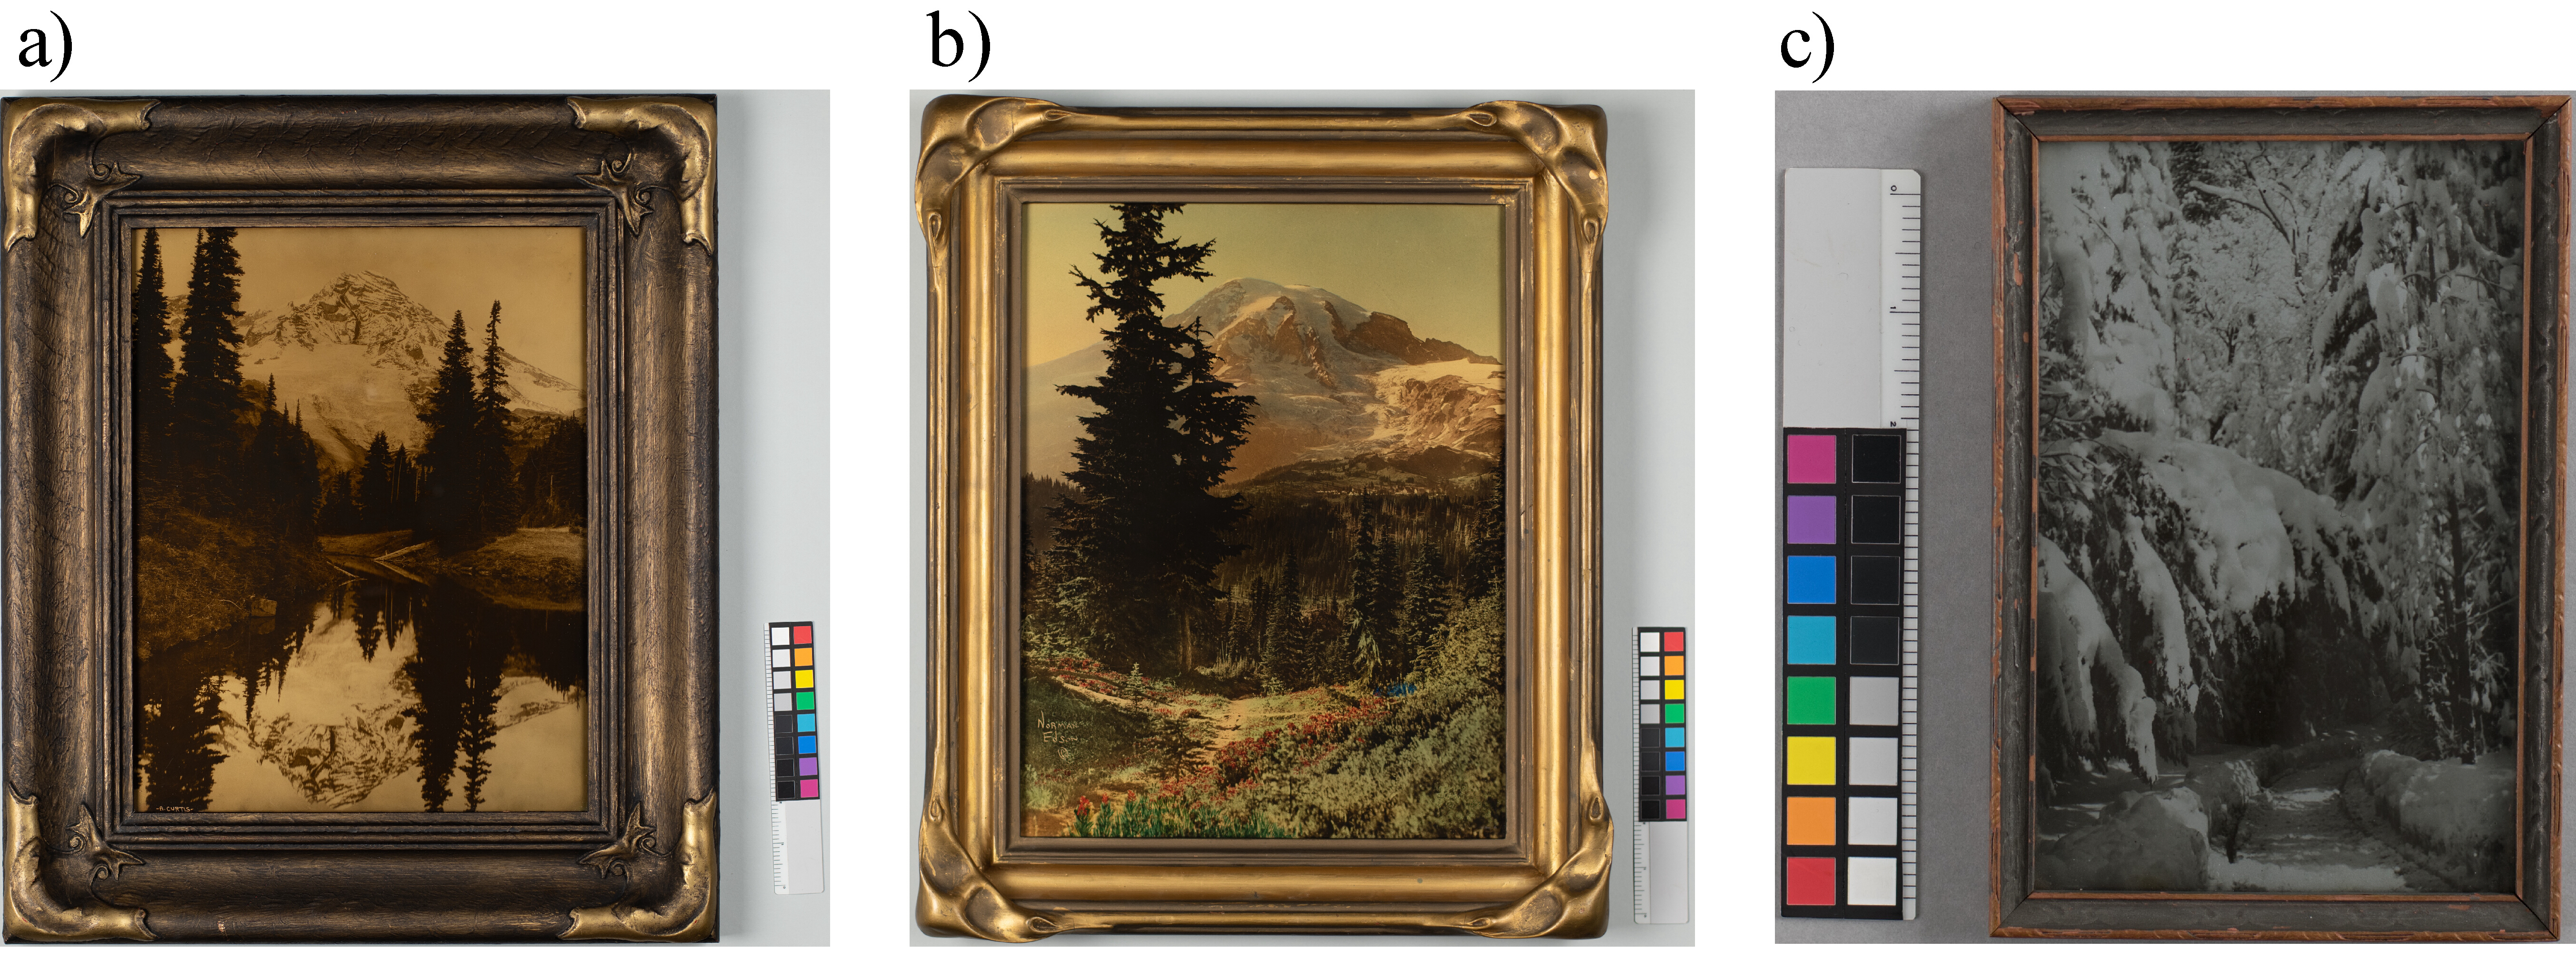
real-world context. The UW Libraries’ collection consists of
thirty-two orotones, including ten hand-colored orotones, two
silvertones, twenty monochrome orotones, and one glass
positive framed with a yellow metallic cardboard backing board
rather than an applied varnish with metal flake (Fig. 1). These orotones range in date from the late 1890s through
the 1970s.
The orotone and silvertone process has its origins in earlier
photographic techniques used to create positive images on
glass, particularly photographically based lantern slides
popular in the last half of the nineteenth century.2
As positive transparencies on glass designed to be viewed
through projection, lantern slides were monochromatic and
could be tinted, chemically toned, or hand colored.3
These projections were a popular form of entertainment and
were used by Edward Curtis in his travelling lectures.4
The first printed record of the orotone process appeared in
November 1858 in the
Journal of the Photographic Society of London in a
letter to the editor by R. M. Grier, in which he described his
invention of a new photographic process utilizing a positive
image on glass backed with a yellow metal “bronzing
powder.”5
However, the process Grier described did not appear to have
gained popularity at the time of publication. Further
experiments with yellow-metal photographic images emerged in
the late-nineteenth century when Hanbeh Mizuno (1852–1920)
introduced the now-obscure maki-e process. The
photographic process combined maki-e, a traditional
Japanese decorative process of sprinkling metallic powder on
lacquered wood, with a French photographic printing technique
known as the dust-on method.6
A mixture of ammonium dichromate, gum arabic, and sugar was
applied to a black-lacquered wood substrate and exposed to
light while in contact with a negative. Nonexposed areas would
retain their tackiness and were sprinkled with gold, which
would form the light parts of the image. Finally, collodion
was applied to protect the surface.7
One type of maki-e photograph utilized a glass
support, though the gold flake in these images was dusted onto
the unexposed areas before the black lacquer was applied,
while orotones were created by a positive image before a
yellow metal layer was applied.8
The studio of Curtis, one of the orotone’s most prominent
practitioners, was a major producer of orotones beginning in
1916.9
By the mid-1910s the orotone process had gained in popularity
and was described in contemporary photographic trade journals
under various names, including dorotype and doretype.10
The process reached its pinnacle of popularity from the late
nineteenth century into the 1920s and remained somewhat
prominent through the 1940s.11
Orotones were created as works of art and were often sold in
characteristic art-nouveau style frames.12
The frames completed the aesthetic presentation and provided
protection for the fragile glass support. The images were
sometimes hand colored and often portrayed natural landmarks
or individuals in studio portraits.13
The popularity of orotones coincided with the American
Pictorialism movement. Pictorial photography emphasized the
artistic use of the medium over its mechanical and scientific
applications. The movement sought to elevate photography to an
art form. Pictorialism was marked by an emphasis on
craftsmanship, with photographers employing a range of
techniques, including selective lighting, composition, and
focus, as well as the application of hand-coated emulsion and
creative photographic-finishing processes. The warm hue, soft
focus, and carefully crafted processing of orotone photographs
reflect the Pictorialist style.14
The Orotone and Silvertone Photographic Process and
Composition
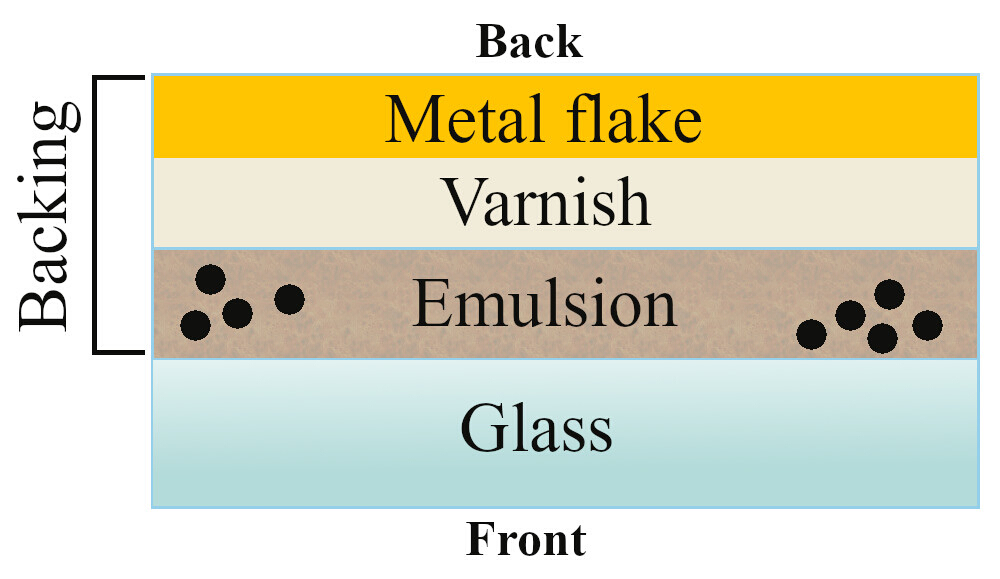
The characteristic layer structure of orotone and silvertone
photographs consists of a glass image support, a
light-sensitized emulsion layer, and a varnish layer with
metal flake. (Fig. 2). The glass support on
which the emulsion was applied was likely soda-lime silica
glass, containing 65–75% silica, 10–20% alkali and the
remainder lime.15
This was the most common and durable glass available in the
early twentieth century. While the photographic development
process used for creating orotones is not documented, it is
likely to have been one of two methods of glass-plate
photography contemporaneous with orotone production: the
wet-plate collodion process, popular from 1851 to 1885,16
or the gelatin dry-plate process, popular from 1880 to
1925.17
Both utilized a well-established method of dispersing silver
halides in the emulsion, exposing them to light, then
developing and fixing the silver clusters to create the
photographic image.
ExpandFig. 2Cross-section of the layer structure of an orotone or
silvertone photograph. The black dots represent silver
atom clusters that form the image. The metal flake can be
present on top of the varnish as shown or mixed into the
varnish.
The chemicals used in the photographic development process and
their reaction byproducts often left residues in the emulsion.
A description of the relevant chemicals in this development
process can therefore inform the interpretation of
compositional analysis. Briefly, the emulsion layer contained
a silver halide dispersion18
containing either iodine, chlorine, or bromine.19
Exposure to light converted the silver ions within the silver
halides to silver atoms which form silver atom clusters.20
A potassium nitrate by-product produced during light exposure
was washed away with water. The final imaging medium consisted
of these silver atom clusters, which were enlarged and
consolidated using a developing agent. A potassium halide
restrainer removed residual halide ions21
while a bath of sodium sulfite, acetic acid, and potassium
aluminum sulfate (colloquially referred to as alum) hardened
the emulsion layer at the end of the process.22
A toning agent may have been used before the emulsion was
hardened to shift the tone of the entire image by replacing
either the silver or halide ions. To provide a sepia (brown)
tone rather than black, sulfur toning was done, which was
described by one source as a step in the orotone development
process and involved converting the silver atom clusters back
to silver halides using potassium ferricyanide and a potassium
halide, which bleached the entire image. The image plate was
then immersed in sodium sulfide, converting the silver halides
to silver sulfide, a dark solid that is more stable than
reduced silver atoms.23
Metals such as platinum and gold have also historically been
used as toning agents in similar photographic processes,
replacing silver ions and impacting the hue and permanence of
the imaging medium.24
Given the limited documentation available for orotone
processing methods, it is unclear to what extent orotones
underwent toning.
If an orotone was hand-colored, pigments were painted onto the
emulsion layer. A varnish was then applied consisting of
collodion dissolved in amyl acetate, acetone, and benzine.
Sometimes castor oil was added to increase flexibility and wax
to decrease glossiness. This solution was termed “banana
liquid” due to the characteristic banana scent of amyl
acetate.25
A metal flake was mixed into the varnish before application
and pouring over the back of the orotone,26
though it may also have been applied after as a leaf or
dust.27
Despite the terms orotone and
silvertone implying the use of gold and silver
metals, neither have yet been identified in these
photographs.28
The terms orotone and silvertone refer to
the color of the metals rather than their composition.
Previous Scientific Research
There are only two technical reports published on orotones and
no published studies of silvertones. The first analysis of
orotones was conducted in 1988 by Siegfried Rempel, who
studied an orotone titled Wisconsin Dells (1897) by
Henry Hamilton Bennett (1843–1908) using XRF spectroscopy. He
concluded that the “bronze powder,” or metal flake, was a
brass alloy of copper and zinc.29
The second study was conducted by Richard Stenman in 2011, in
which he analyzed four orotones using XRF spectroscopy and
scanning electron microscope/energy dispersive X-ray
spectroscopy (SEM/EDS). He concluded the following: the image
material for three out of the four images studied was a silver
halide; toning agents may have been present in one orotone,
indicated by the detection of sulfur in image areas containing
silver; the elements potassium, arsenic, strontium, barium,
iron, and calcium were detected and hypothesized to originate
from the glass support; and the metal flake was composed of
copper and zinc. Using FTIR spectroscopy, Stenman determined
that the emulsion was composed of gelatin in three orotones
from the 1920s and 1930s, attributed to the gelatin dry-plate
process, while an older orotone contained a collodion emulsion
associated with the older wet-plate collodion process.
Collodion was identified by FTIR in the varnish layer of all
orotones studied, along with metal stearates, added as a
stabilizer.30
Rempel’s and Stenman’s contributions to the available
knowledge of orotones was significant; however, they both
noted that analyzing a larger sample set would add to their
findings.
Specific Aims and Scope
This project aimed to build upon Rempel’s and Stenman’s work
by performing materials analysis on a range of orotones and
silvertones from the UW Libraries. The materials analyzed
included the glass image supports, elements associated with
the photographic development process, pigments in hand-colored
orotones, metal flake in orotones and silvertones, and the
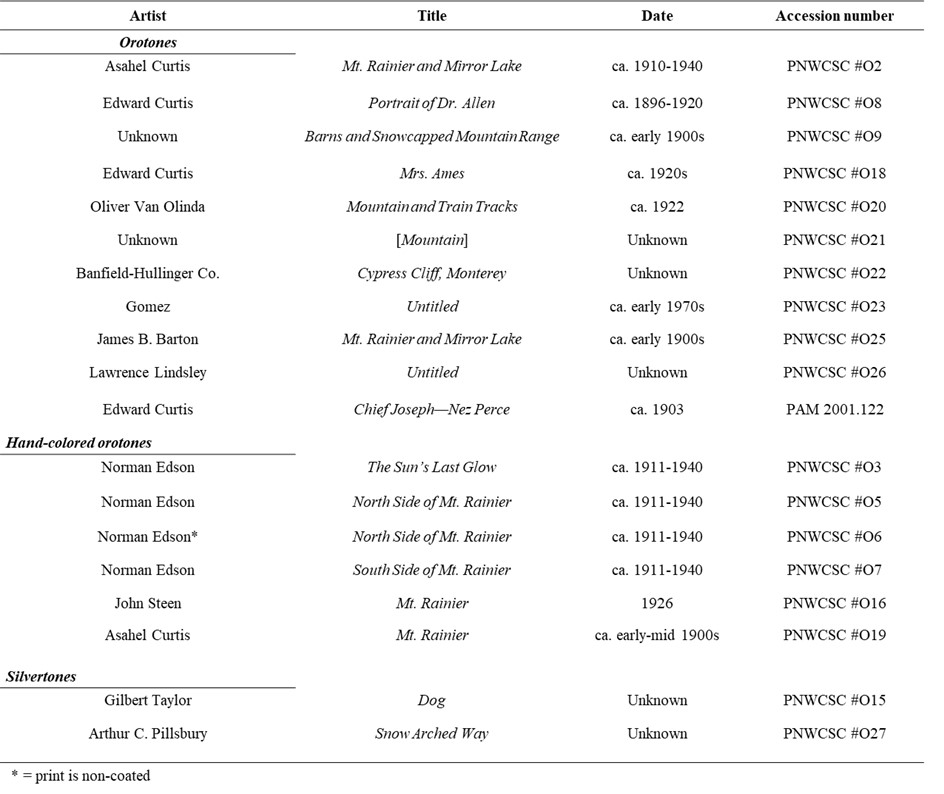
emulsion and varnish layers. Eighteen photographs in the UW
Libraries’ permanent collection were analyzed including
sixteen orotones, six of which were hand-colored, and two
silvertones. One orotone did not contain an applied metal
flake, and instead was backed with a gold-colored board. All
were given unique numbers for this study, formatted as PNWCSC
#O1 (Table 1). An orotone from the Portland
Art Museum (PAM) was also analyzed which has undergone
delamination. By comparing the orotone from the PAM with those
from the UW Libraries, it was hoped that the cause of
delamination could be identified.
ExpandTable 1List of Orotones, Silvertones, and Hand-colored
Orotones
Materials and Methods
Visual Examination of the Metal Flake and Varnish Layer
The backs of all orotones were photographed and a subset of
six orotones (PNWCSC #O2, #O9, #O16, #O19, #O20, and PAM
2001.122) was examined to determine if the application of
metal flake could be inferred by the overall appearance of the
flake and varnish layers. Varnish microsamples containing
metal flake were collected from these six orotones and imaged
using a Leica MZ6 stereomicroscope using the program Leica
Application Suite Version 4.12.0 (Leica Microsystems,
Deerfield, IL, USA) and utilizing a Volpi Intralux 4000-1
fiber optic light source (Volpi Group, Auburn, NY, USA). By
comparing the stereomicrographs of the microsamples with the
photographs of the orotone backings, the flake application
method could be inferred.
Glass Density Calculations
The dimensions and masses of orotones PNWCSC #O2, #O8, #O9,
and #O18 were measured to calculate glass density and
determine whether glass was soda-lime-silica or a more dense
glass such as lead glass. Varnish and backing layers were
accounted for by assuming a backing thickness of 0.003 cm,
which is double the thickness of previously published
measurements of gelatin films on glass.31
Assuming a density of 0.77 g/cm^3^ for collodion and 1.27
g/cm^3^ for gelatin, masses were calculated for each layer and
subtracted from the total orotone mass while film thickness
was subtracted from measured thickness. Correcting for this
layer only increased the calculated glass density by <1%.
Therefore, a simple calculation of total mass (g) /
total volume (cm^3^) was used to calculate glass
density for the four orotones.
XRF Spectroscopy
XRF spectroscopy was utilized to qualitatively determine the
elemental composition of all orotones and silvertones in this
study. This method was chosen as it allows for non-destructive
analysis of elements within the layers of the orotone and,
with the use of filters, can be optimized for collecting
elements with wide-ranging atomic masses. It significantly
reduces the requirement for sampling. Finally, it reproduces
the method of analysis used by Stenman in his study of
orotones32
and has been documented as a successful method for
characterizing the composition of photographic materials.33
Spectra were collected with a Tracer III-SD XRF spectrometer
(Bruker, Billerica, MA, USA) equipped with a rhodium (Rh)
source silicon drift detector (SDD), and connected to a 3V
vacuum pump (Bruker, Billerica, MA). All spectra were
collected at a pressure of less than 30 Torr and a beam spot
size of approximately 10 mm. A red filter was used for most
orotones, which is composed of three stacked filters
(0.001-inch copper and titanium filters and a 0.012-inch
aluminum filter). When using a red filter, voltage was set to
40 kV, current to 7.60 μA, and acquisition times to 20, 60, or
300 seconds. In some cases, a blue filter, or 1-mm titanium
filter, was used, and voltage was set to 20 kV, current to 55
μA, and acquisition time to 60 seconds. If no filter was used,
acquisition parameters were set to 40 kV, 7.60 μA, and
acquisition time set to 30 or 60 seconds. Settings were
selected to maximize count rate without saturating the
detector. The unframed orotones from the UW Libraries’
collection were placed on a polyethylene foam support to
reduce background noise and covered by a mylar sheet with
~7-mm diameter holes over the test areas. The instrument was
mounted on a tripod and positioned perpendicular to the
orotones at a distance of approximately 2 mm and aligned to
each location using crosshairs on an alignment map on mylar.
Nine of the photographs from the UW Libraries’ collection were
analyzed, both from the front through the glass and from the
back over the metal flake; the other eight photographs were
only analyzed from the back.
Background spectra were collected at each instrument setting
used for analysis. All spectra were normalized to the Compton
peak unless collected using only a titanium filter, in which
case the spectra were normalized to the background titanium
peak. After normalization, background spectra were subtracted
from orotone spectra that had been acquired under the same
parameters. Spectra collected from the front, accounting for
the glass, were also subtracted from spectra collected from
the back, leaving only elements associated with the metal
flake and imaging materials in the emulsion layers. Peaks not
associated with the metal flake in the corrected spectra were
associated with photographic materials in the emulsion layer.
If a spectrum was not collected from the front, elements were
assigned to layers based on how they tracked with the image,
what the literature indicated, or how the results compared
with other orotones.
Results were reported as signal-to-noise ratios (S/N) and were
standardized to a 60-second acquisition time, as the S/N
increases with the square root of the total acquisition time.
Reporting data as S/N ratios provides objectivity to the
identification of elements within the orotone and provides a
consistent benchmark for both instrument performance and
detection limits when reporting minor or trace elements. S/N
values have consistently been used in forensic analysis of
glass and art materials.34
Comparing S/N values in the metal flake provided compositional
information allowing for more detailed comparisons of alloys
across orotones. Furthermore, by assigning a detection limit
value for S/N, data were eliminated that did not meet criteria
for detection. In this case, an S/N value of 10 or greater was
used as a benchmark for detection, while values less than 10
were attributed to trace elements.
SEM/EDS
SEM/EDS was carried out on the silvertone microsample to
verify XRF results and determine the metal flake composition.
EDS is more sensitive to elements of low molecular weights and
is therefore suited to detecting metals such as aluminum. The
microsample was mounted onto carbon tape affixed to an
aluminum sample holder and surrounded at a short distance by
strips of copper/nickel tape to minimize charging. The sample
was analyzed by SEM/EDS using a Sigma variable-pressure field
emission SEM (FESEM) (Zeiss, Oberkochen, Germany) equipped
with an Ultim Max 65-mm^2^ energy dispersive X-ray detector
(Oxford Instruments, Abingdon, UK). EDS elemental mapping was
performed with AZtec software (Oxford Instruments, Abingdon,
UK). Acceleration voltage was set to 20 kV, working distance
to 8.3 mm, and processing time to 3 for adequate dead time.
FTIR Microanalysis
Microsamples of the emulsion and varnish layers from PNWCSC
#O2, #O9, #O16, #O20 and PAM 2001.122 were analyzed using
µFTIR spectroscopy to obtain compositional information.
Additionally, two pigmented microsamples collected from the
edge of PNWCSC #O3 were analyzed to aid in pigment
identification—one from a red pigment in a tree and the other
from a blue pigment in the sky. Both samples included the
pigment, the emulsion layer, and the varnish layer with metal
flake. µFTIR spectroscopy does not destroy the sample,
allowing for further analysis and verification of findings.
The orotones chosen for sampling represented a range of
artists and dates from the early twentieth century. Analysis
utilized a Nicolet Continuum FT-IR microscope coupled to a
Nicolet iS10 infrared spectrometer (Thermo Fisher Scientific,
Waltham, MA) with a 50-μm nitrogen-cooled mercury cadmium
telluride type A (MCT/A) detector and operated using Omnic
software (version 8.3.103). The varnish and emulsion samples
were compressed onto a diamond cell. Spectra were acquired in
transmission mode between 750 and 4000 cm^-1^ at 4 cm^-1^
spectral resolution. 64 scans were averaged per spectrum. The
data were transformed using an N-B strong apodization function
and Mertz phase correction. Once collected, the spectra were
converted to absorbance and compared to the IRUG
databases.35
Raman Spectroscopy
Raman spectra were collected to aid in pigment identification.
Spectra were collected using a LabRAM HR Evolution Raman
spectrometer (Horiba Scientific, Ltd., Kyoto) with a Synapse
detector, using a 532-nm mpc6000 laser (Laser Quantum,
Fremont, CA) operating at 4.8 mW, a neutral density filter at
2.5%, and a grating of 600 lines/mm. The spatial resolution
was 1.3 μm under a 50× objective with a 400-μm confocal hole.
The acquisition time was 5 seconds for 30 accumulations in the
range of 100 to 3000 cm^-1^ with a 5.7 cm^-1^ spectral
resolution. The spectra were collected and baseline corrected
using LabSpec6 (version 6.3.40.9).
Py/GC/MS
Pyrolysis/gas chromatography/mass spectrometry (Py/GC/MS) was
carried out on backing samples from PNWCSC #O2, #O9, #O16,
#O20 and PAM 2001.122 as well as on mock-up varnishes created
using cellulose nitrate and amyl acetate. This mass spectral
method provided verification of FTIR findings as well as
greater sensitivity, allowing for identification of major and
minor organic components of the emulsion and varnish layers.
Amyl acetate, which may remain in trace amounts in the orotone
varnishes, is likely only detectable using this method.
Py/GC/MS was carried out with a Model 4000 Pyroprobe (CDS
Analytical, LLC, Oxford, PA) coupled to a 6890N GC system and
a 5973 inert standard turbo electron ionization (EI)
mass selective detector (Agilent Technologies, Santa Clara,
CA) with a quadrupole mass analyzer and electron multiplier
detector. The chromatographic column was a J&W DB-5 fused
silica capillary GC column (30 m × 250 μm × 0.25 μm) with a
(5%-phenyl)-methylpolysiloxane stationary phase (Agilent
Technologies, Santa Clara, CA).
The Py/GC/MS method was adapted from literature.36
Pyrolysis was carried out at an initial interface temperature
of 75°C for 0.1 min followed by a ramp of 100°C/min and a
final temperature of 125°C held for 3 minutes. Pyrolysis was
initiated when the final interface temperature reached 125°C.
The initial temperature of the pyroprobe was 125°C, followed
by a ramp of 10.0°C/msec and a final pyrolysis temperature of
600°C held for 10 seconds. The front inlet temperature of the
GC was held at 250°C. The carrier gas was helium, the flow
rate was 1.0 mL/min, and the nominal inlet pressure was 7.62
psi. The chromatograms were collected in splitless mode, so
the purge flow was adjusted to 49.9 mL/min to achieve the same
total flow (53.6 mL/min) as the literature method. The GC oven
was programmed with an initial temperature of 50°C held for 5
min followed by a ramp of 5°C/min to 240°C held for 5 min, and
then finally a ramp of 5°C/min to 300°C held for 8 min. This
was followed by a cool-down ramp of 50°C/min to 200°C, a hold
of 2 min, then a ramp of 50°C/min to 100°C, and a hold for 2
min. A temperature of 50°C was held for 1 min post-run. The
MSD transfer line was kept at 250°C. The mass spectra were
collected with EI at 70 eV over the m/z range of 40–600
without a solvent delay. The MS ion source was held at 230°C
and the MS quadrupole was held at 150°C. The data were
collected and processed using ChemStation E.02.02.1431
(Agilent Technologies, Inc., Santa Clara, CA). Preliminary
identification of compounds was achieved by comparing
collected spectra to the NIST/Wiley (W8N08) MS library (John
Wiley and Sons, Inc., Hoboken, NJ). User-created mass spectral
libraries of reference binders were also used to identify some
compounds.
Results and Discussion
Metal Flake Analysis
Visual Analysis
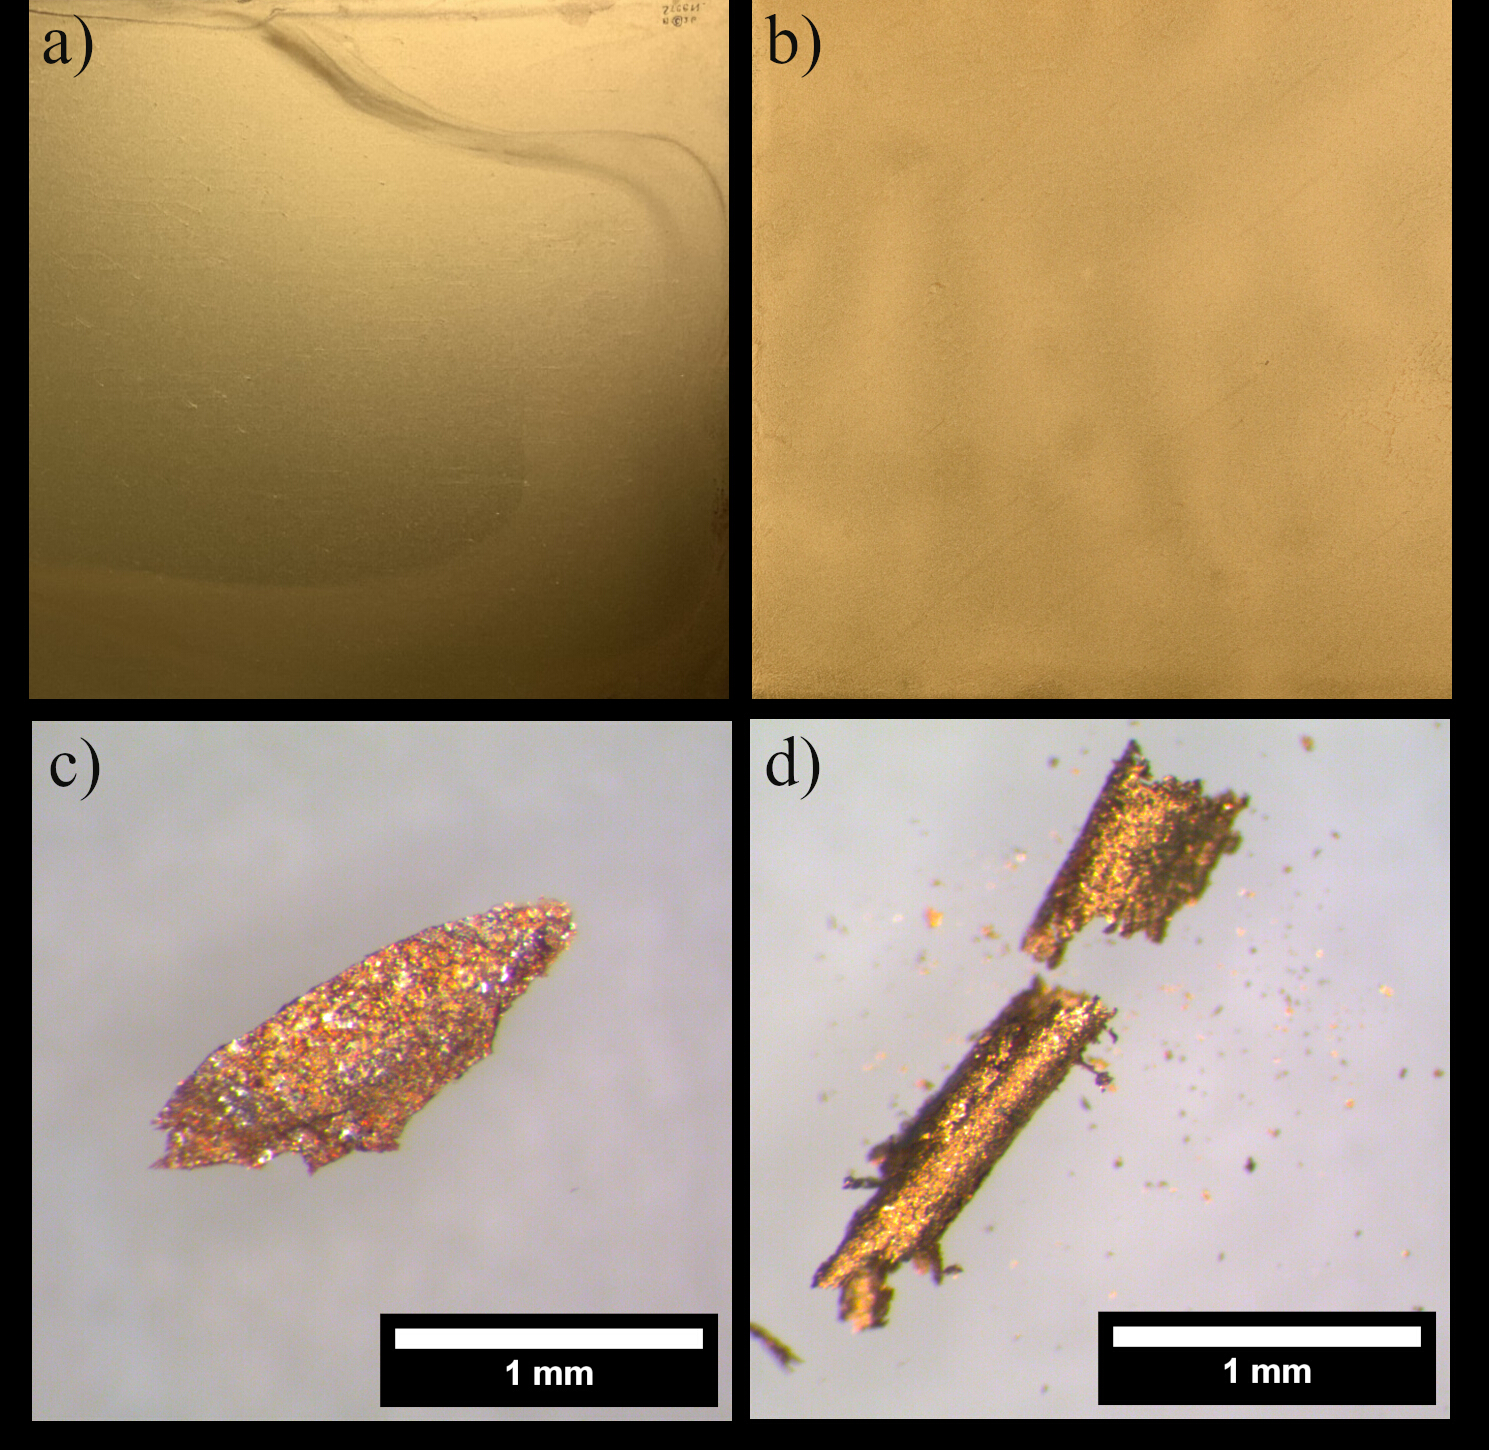
Visual analysis of backings and microsamples indicate that the
six orotones examined represent cases of both mixed-in metal
flake and dusted-on flake.
Figure 3 demonstrates how both backings and
microsamples appear for each type. The dusted-on orotones are
characterized by an uneven reflective yellow color caused by
localized differences in metal flake density during the
dusting-on process, and microsamples from these orotones are
distinguishable for being especially reflective and friable
(Fig. 3b and d), compared to those from
mixed-in orotones. The mixed-in metal flake varnishes were
typified by very even metal flake distribution, in one case
containing striations from the pouring-on process, while
microsamples were solid without friation and with flake
distributed throughout (Fig. 3a and c).
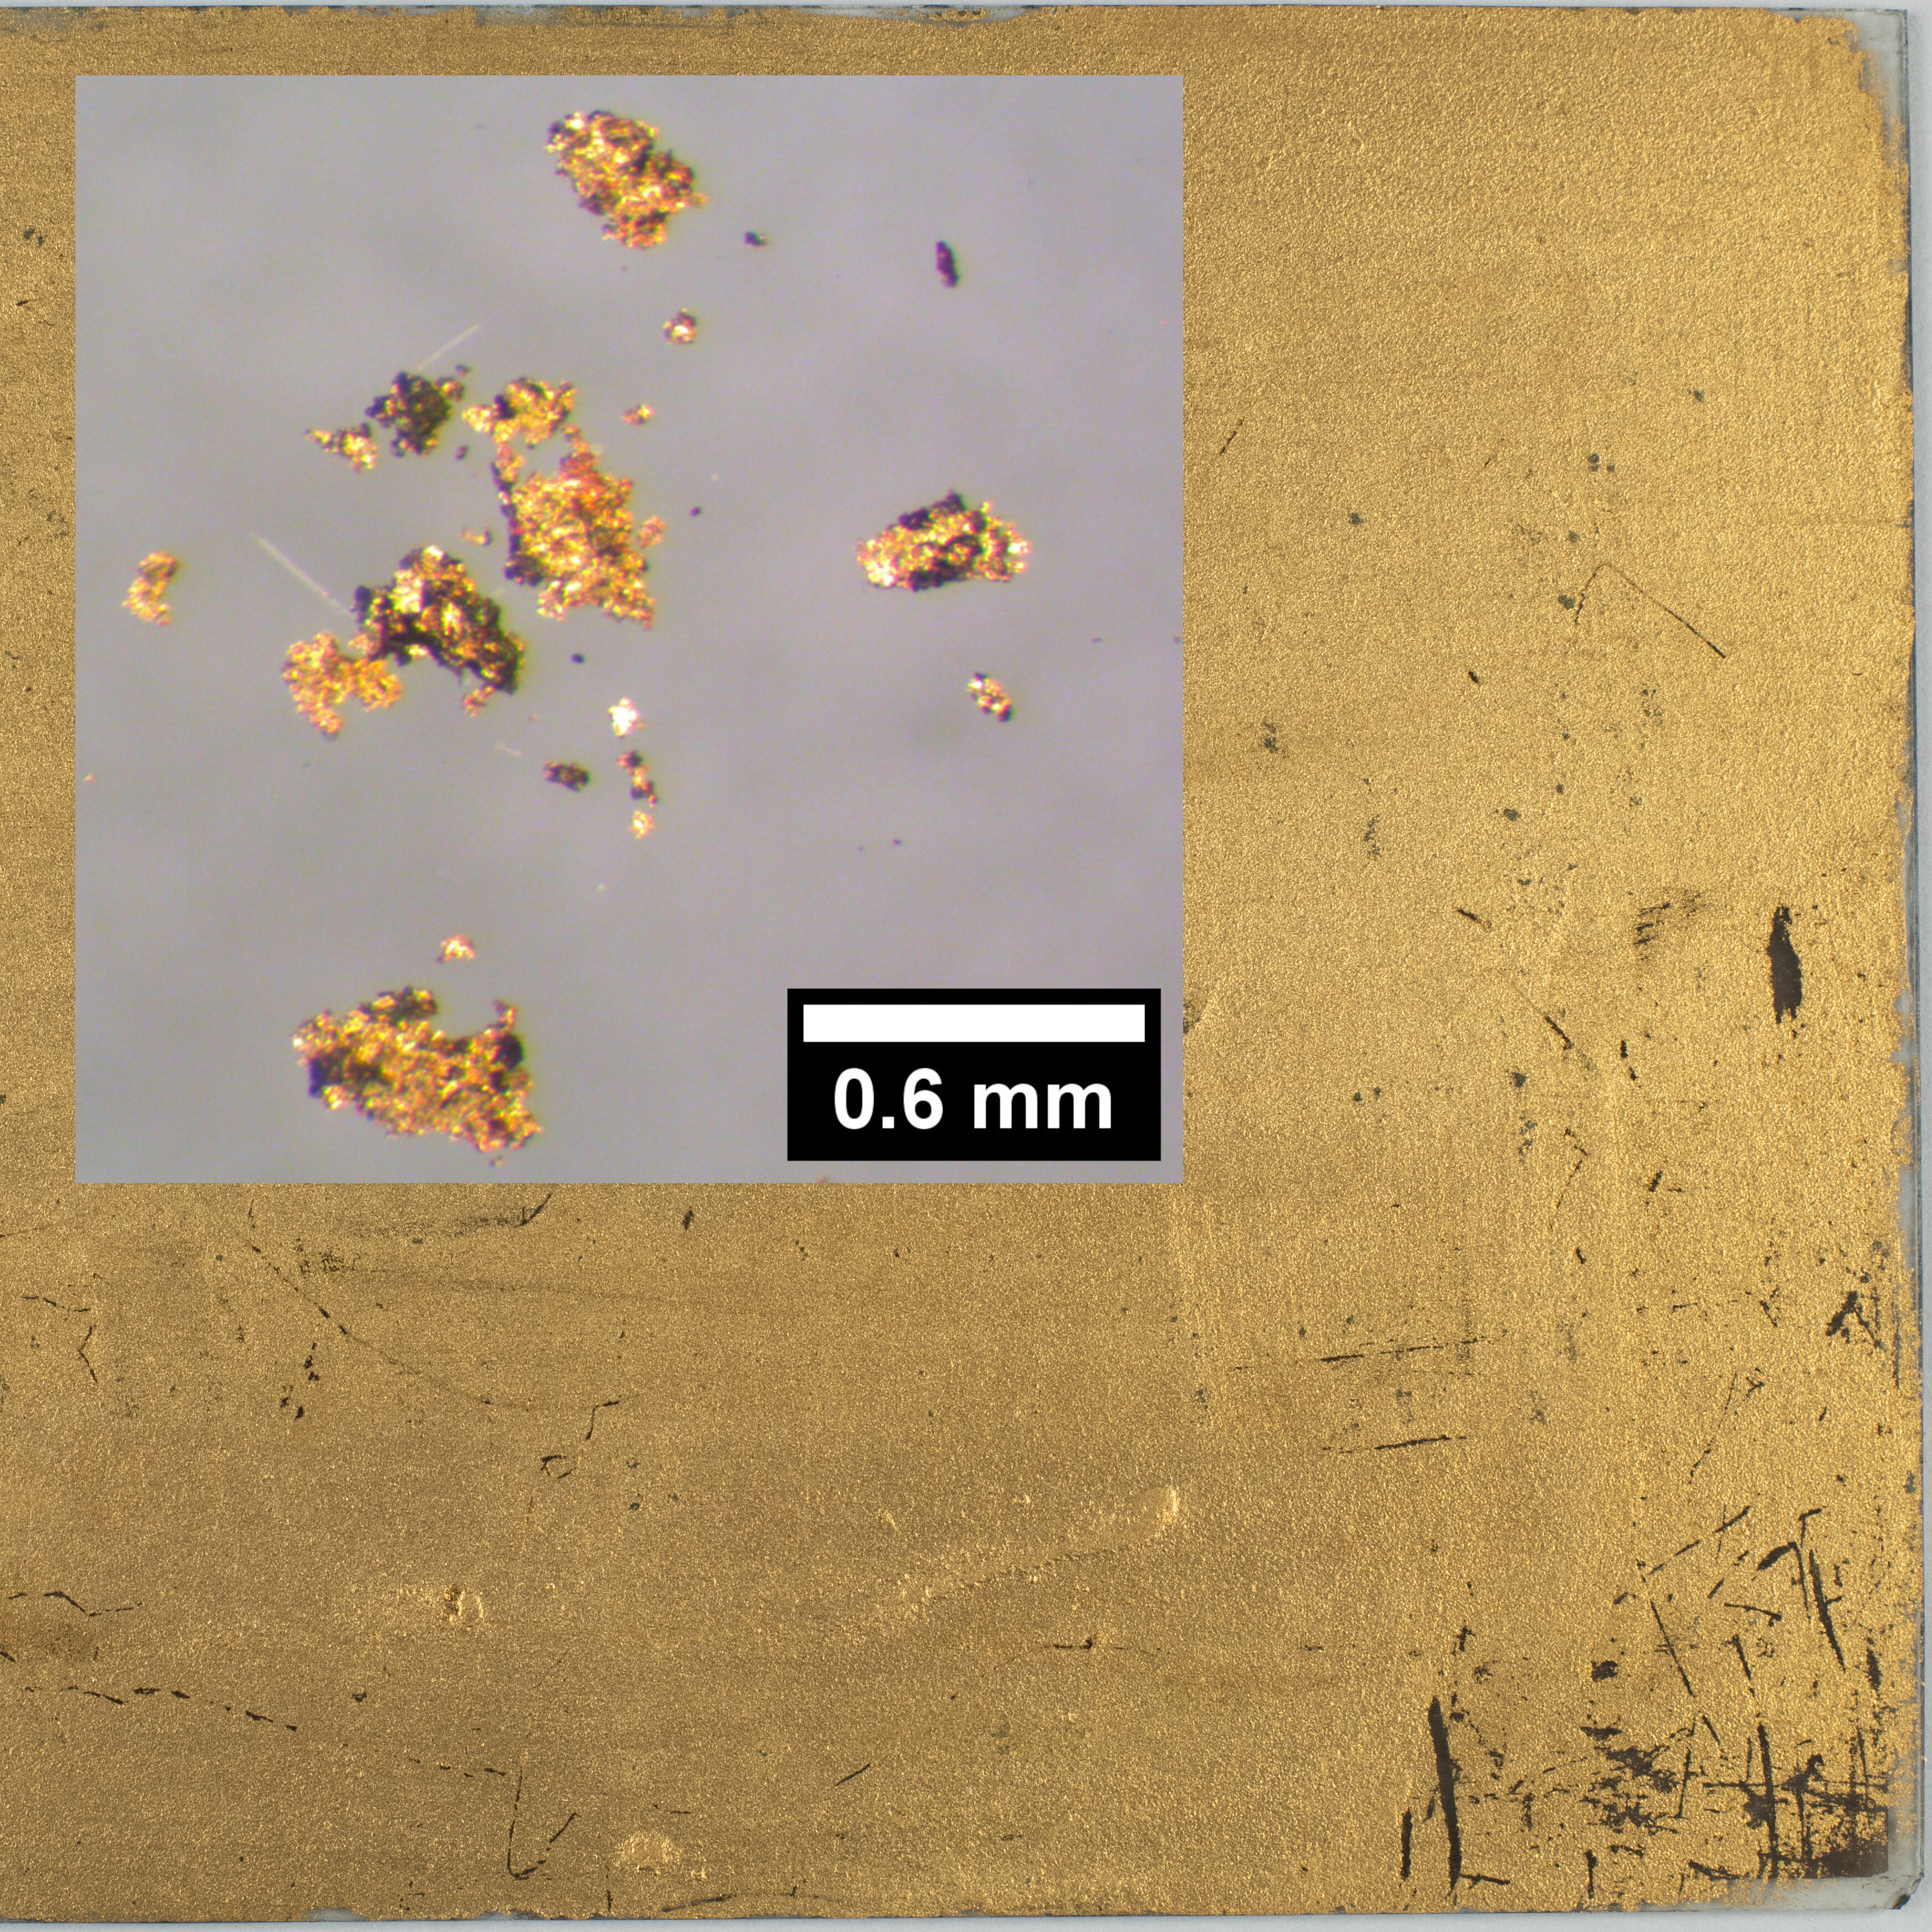
ExpandFig. 3a) the backing of PNWCSC #O16 with clear striations
associated with a poured-on varnish with metal flake mixed
in b) the backing of PNWCSC #O18 with a characteristically
uneven density of gold tone typical of a dusted-on metal
flake (c) a microsample from PNWCSC #O2 with metal flake
distributed through the entire varnish, indicating a
mixed-in metal flake d) a microsample from PNWCSC #O18
indicates a dusted-on flake with its very shiny, friable
surface.
Visual examination indicated that the metal flake of three
orotones had been dusted on after varnish application (PNWCSC
#O9, #O18, and #O20, PAM 2001.122) while the metal flake of
two other orotones had been mixed into the varnish and poured
on (PNWCSC #O2 and #O16). PNWCSC #O9 appeared to have an even
distribution of flake (consistent with a mixed-in flake
varnish); however. the loss of metal flake from abrasions
without the loss of the image or underlying varnish as well as
the tendency of the microsample to shed metal flake indicated
that the metal flake was dusted-on (Fig. 4).
ExpandFig. 4The backing of PNWCSC #O9 shows abrasions and loss of
flake in the lower right corner, indicating the flake was
dusted on. This is confirmed by a fragmented and friable
microsample of the backing at 40x magnification.
Two orotones with dusted-on metal flake are attributed to
Edward Curtis (PNWCSC #O18 and PAM 2001.122), while two
mixed-in flake varnishes were found in orotones by his brother
Asahel Curtis (1874–1941) (PNWCSC #O2) and John Steen (PNWCSC
#O16). John Steen was known to be an employee of Asahel
Curtis, who in turn worked in the Edward Curtis studio in
Seattle producing orotones.37
Notably, the brothers used different metal flake application
methods in the orotones mentioned. Documentation implies that
Edward Curtis primarily mixed-in the metal flake and poured it
on,38
while results of examination indicate that at least some of
his orotones were created with the dust-on method.
Elemental Analysis
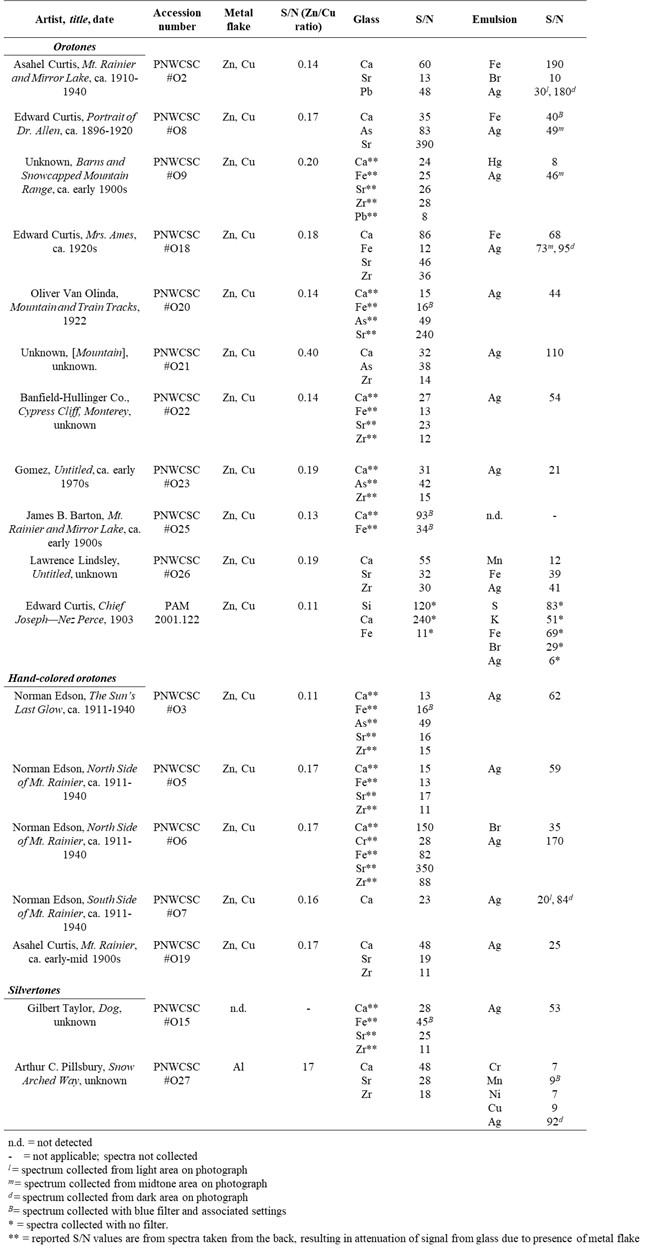
Copper and zinc were detected in every orotone analyzed in
this study using XRF spectroscopy (Table 2),
indicating that brass metal flake was used. Dividing S/N
values of zinc by copper revealed all brass metal flake to be
similarly composed (with ratios ranging from 0.10–0.20) except
for PNWCSC #O21, which had a ratio of 0.40.
ExpandTable 2XRF spectroscopy results for elements related to the
metal flake, glass, and emulsion. All spectra acquired
with red filter, at 40 kV μA, unless indicated
otherwise.
Aluminum was tentatively identified by XRF spectroscopy in
PNWCSC #O27 based on an unusually high-intensity peak with an
S/N value of 17. Given that aluminum’s emission energy is near
the lower detection limit of the XRF instrument, this
indicated that the metal flake was likely composed of
aluminum, but verification with another technique was
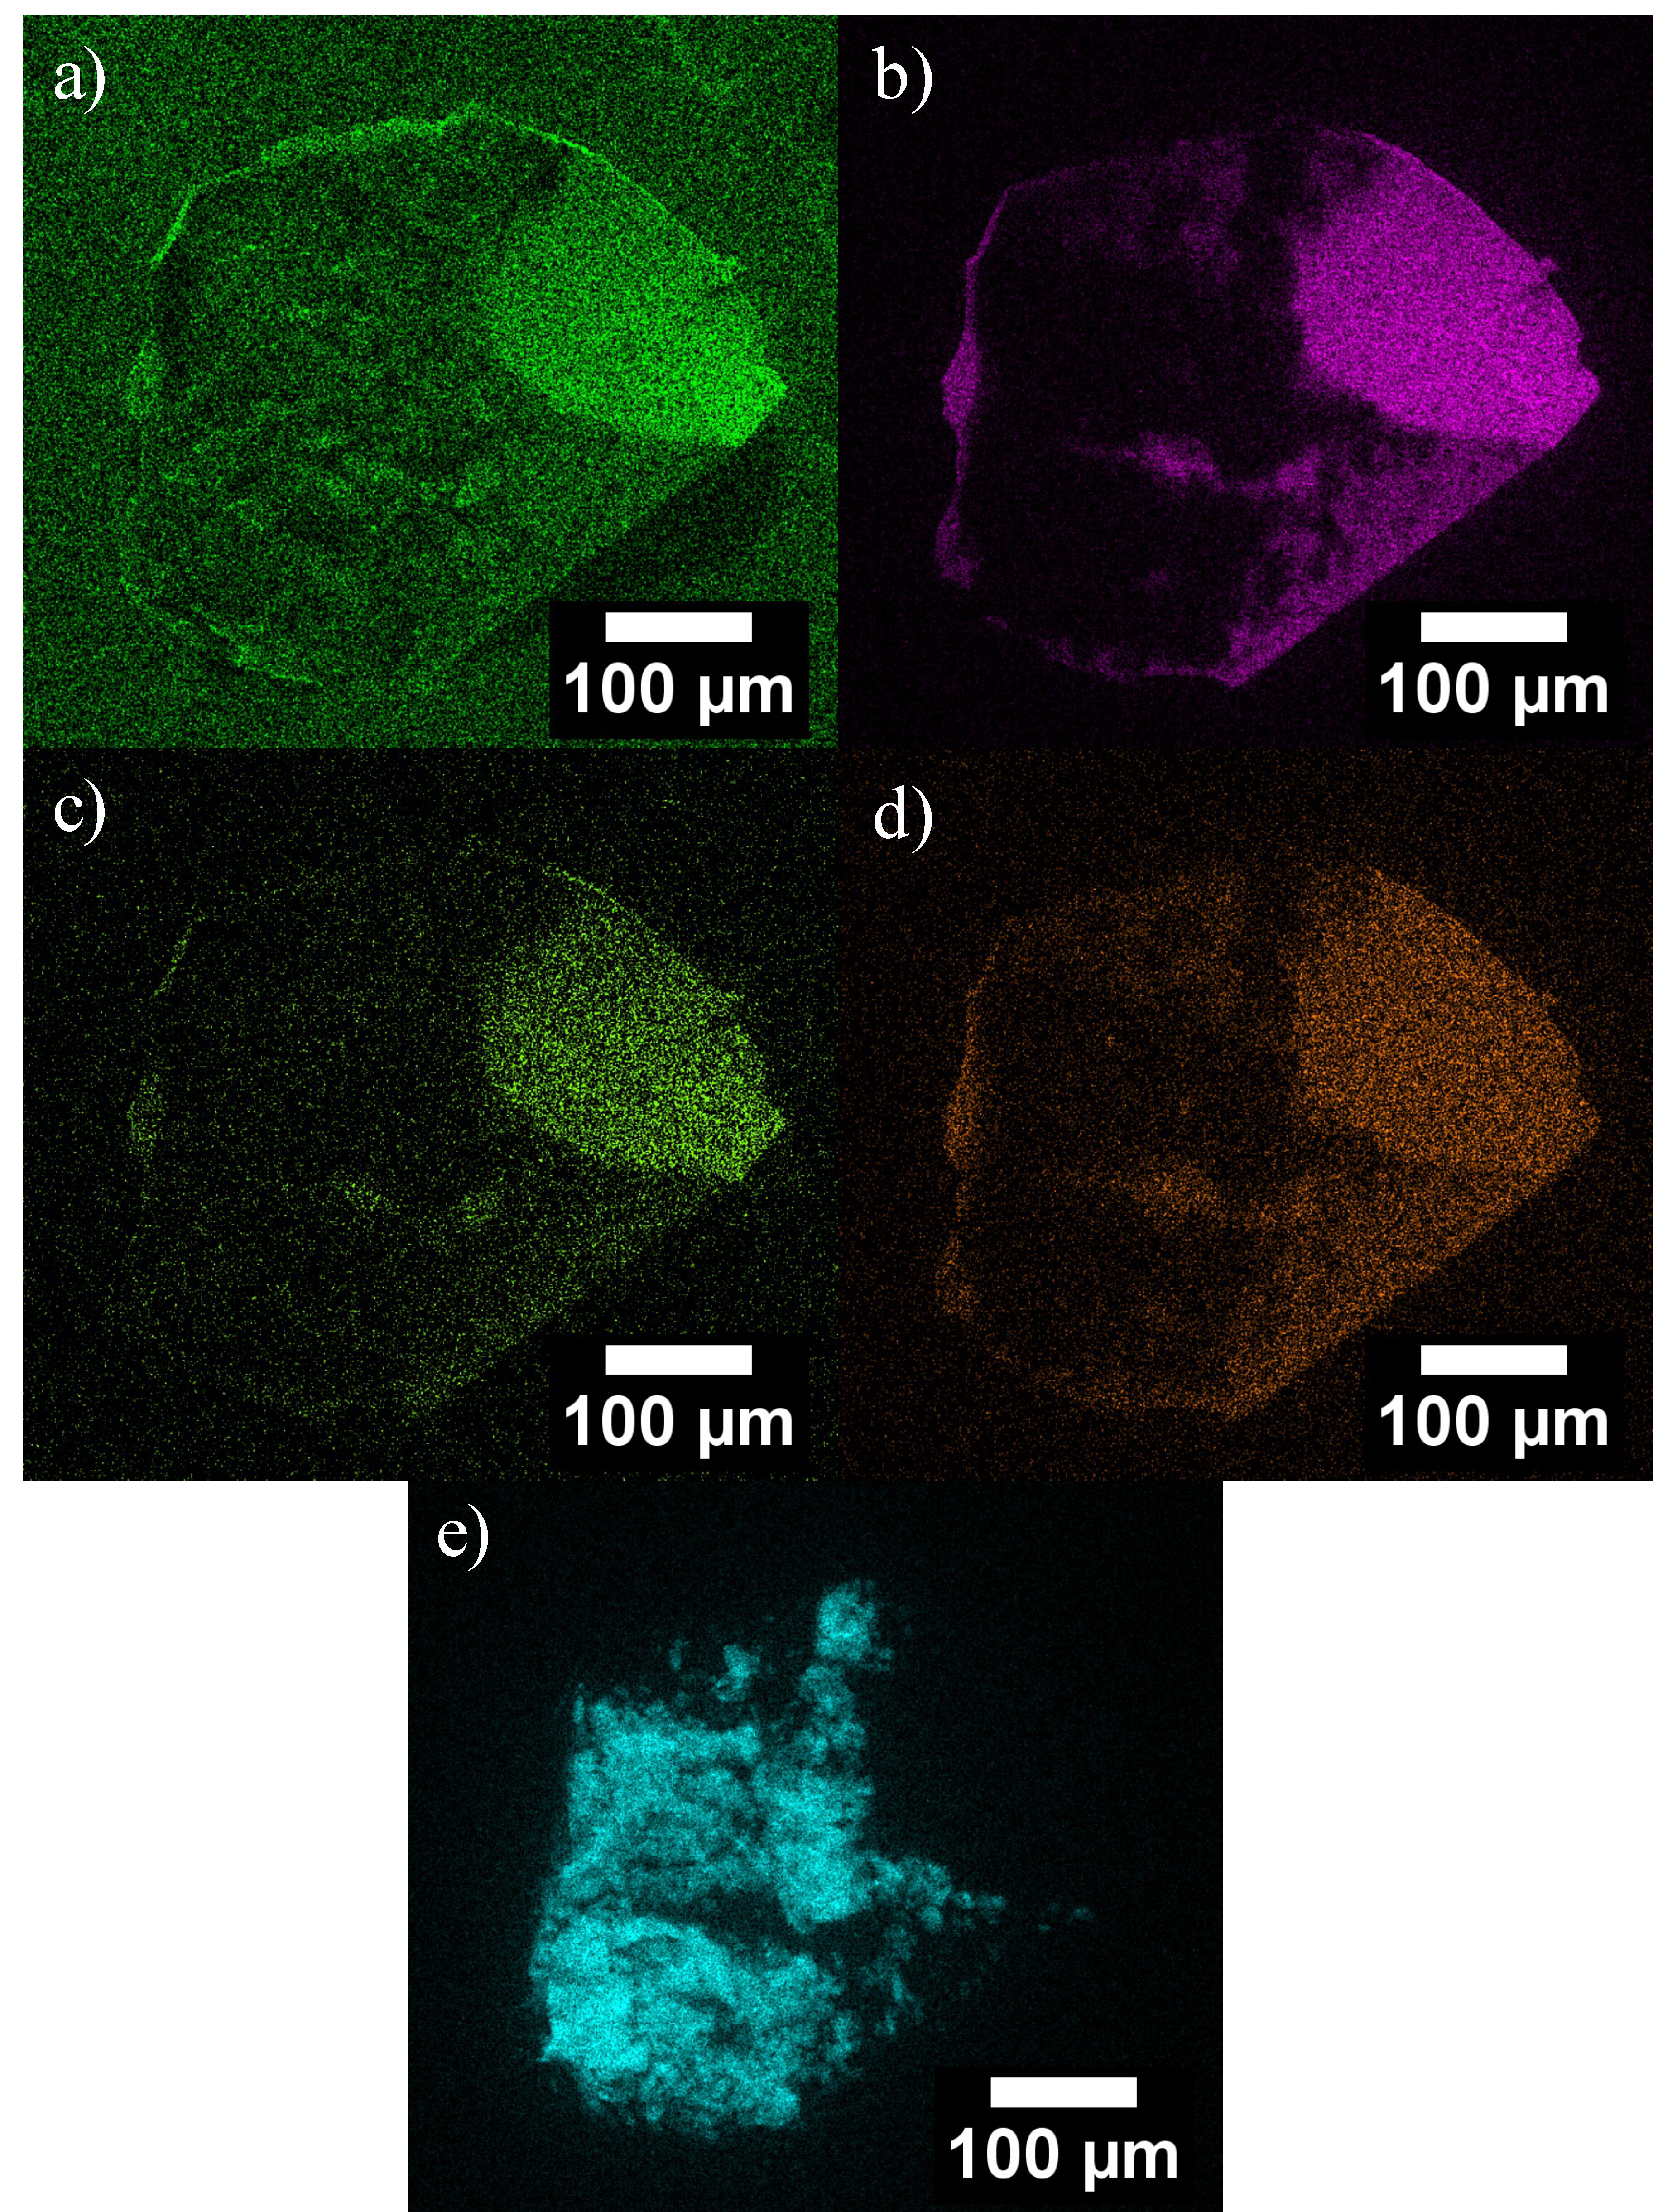
required. Elemental maps were collected of a microsample from
silvertone PNWCSC #O27 using SEM/EDS and identified aluminum
in the lower left region of the sample (Fig. 5e), verifying that the metal flake used in this silvertone was
an aluminum metal flake.
ExpandFig. 5a) Oxygen, b) silicon, (c) sodium, d) calcium, and e)
aluminum SEM/EDS elemental maps collected from the PNWCSC
#O27 microsample.
Glass Analysis
Elemental Analysis
XRF spectroscopy identified strontium, iron, and zirconium in
the glass of most orotones and silvertones. These elements
have been identified as common elements in glass.39
Calcium was identified in the glass of all orotones, likely
originating from the lime, or calcium oxide, added to
soda-lime-silica glass to improve its chemical durability.40
Calcium along with oxygen, sodium and silicon were identified
in the glass of PNWCSC #O27 using SEM/EDS elemental maps,
verifying that soda-lime-silica glass was used (Fig. 5a–d). Arsenic was identified by XRF in the
glass of five orotones. Arsenic is added to glass to provide
clarity, improve color and transmittance, or prevent the
formation of bubbles.41
Chromium was detected in the glass of PNWCSC #O6 and may have
been used as a glass colorant.42
Lead was identified in PNWCSC #O2, implying the glass may be
lead glass or soda-lime-silica glass with a lead impurity or
additive.
Glass Density Calculations
Glass density was calculated to determine if the presence of
lead indicated lead glass or a soda-lime-silica glass with
impurities. A density of 3.1 to 5.9 g/cm^3^ is expected for
lead glass while soda-lime-silica glass has a density of 2.4
g/cm^3^.43
All four orotones studied (PNWCSC #O2, #O8, #O9, and #O18) had
glass densities less than 2.4 g/cm^3^, ranging from 1.55–2.07
g/cm^3^, indicating that they were soda-lime-silica glass with
small amounts of lead and arsenic added to improve glass
properties. Lead is often added to glass for its fluxing
effect or for its higher refractive index.44
Imaging Media and Processing Chemicals: XRF Analysis
Silver was identified as the imaging medium for 9 out of the
11 analyzed orotones (Table 2). This was
further verified by differences in peak intensities between
dark and light image areas in PNWCSC #O2 and #O7. Silvertone
PNWCSC #O27 and orotones PNWCSC #O8, #O9, and #O18 contained
high silver peaks in dark and mid tone image areas and no
silver in light image areas, further verifying that the
imaging medium was silver. Bromine was identified in three
orotones, originating from either silver bromide crystals in
the emulsion that were not washed away after sensitization or
residual potassium bromide used at multiple stages in the
developing process. Trace mercury (Hg) was identified in
PNWCSC #O9, although its origin is unclear. Iron was present
in five orotones, likely left over from the potassium
ferricyanide bleaching agent. Three orotones (PNWCSC #O2, O18,
and O26) were analyzed at high-density and low-density image
areas, yet the iron peaks in both spots were of about the same
intensity. This suggested that the iron was evenly dispersed
in the emulsion and was likely from a potassium ferricyanide
bleaching agent applied to the whole photograph.
Analysis of Pigments in Hand-Colored Orotones
Elemental Analysis: XRF Spectroscopy
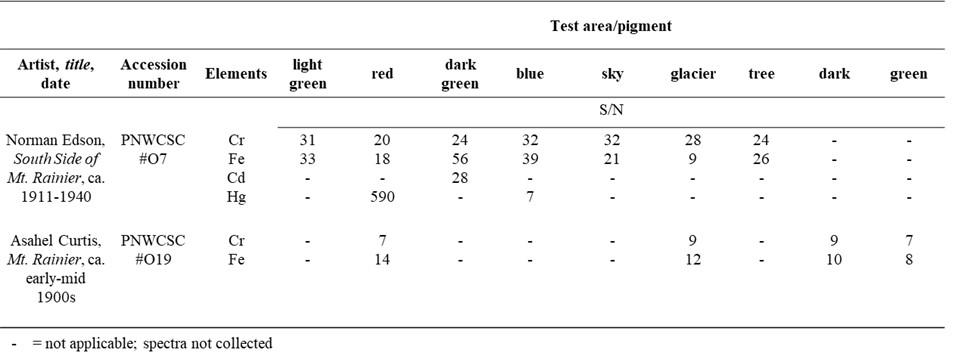
Seven areas of hand-colored orotone PNWCSC #O7, corresponding
to seven different pigments, were analyzed using XRF
spectroscopy (Fig. 6a, Table 3).
ExpandTable 3XRF spectroscopy results for elements related to
colorants in hand-colored orotones
A high-intensity mercury peak with an S/N value of 590 was
identified in the red pigment at Spot 02, indicating vermilion
(Fig. 6b). Chromium peaks, with S/N values
ranging from 20 to 32, were identified in all test areas.
These values are much higher than those found in other
orotones, which contain S/N values around 9, indicating only
trace amounts of chromium due to bleaching agents or chrome
alum hardeners. The intensity of the chromium peaks in PNWCSC
#O7 compared to other orotones, as well as a distinct yellow
cast compared to the others, indicates a likely chromium
yellow wash over the whole orotone.
ExpandFig. 6a) PNWCSC #O7 with all test areas labeled and b) the XRF
spectra collected for some of those areas (40 kV, 7.60 μA,
60 sec acquisition time, and 0.001” Cu, 0.001” Ti, and
0.012” Al filter) with low-energy (top) and high-energy
(bottom) insets. Elements with an asterisk (*) were
present from the background or instrumental
artifacts.
Cadmium was identified in a dark green pigment in PNWCSC #O7
(Spot 03), suggesting a mixture of cadmium yellow with a blue
pigment. Spot 03 also contained a notable iron peak,
suggesting the blue pigment might be Prussian blue.
Iron was detected throughout orotone PNWCSC #O19 and was
determined to originate from pigments, but specific
iron-containing pigments could not be identified by XRF.
µFTIR Analysis of PNWCSC #O3 Pigments
Two pigmented microsamples collected from the edge of another
orotone, PNWCSC #O3, were analyzed via µFTIR spectroscopy. The
red pigment could not be identified, while the blue pigment
contained a strong amide I band at 1645 cm^-1^ and an amide II
band at 1543 cm^-1^ (Fig. 7a) corresponding
to a protein backbone as shown in the reference protein
spectrum (Fig. 7b), as well as a peak at 2083
cm^-1^ attributed to a nitrile functional group. This
functional group is present in Prussian blue
(Fe~4~[Fe(CN)~6~]~3~) (Fig. 7c) as well as
the bleaching agent used in the photographic process,
potassium ferricyanide.
In order to determine the origin of the amide bands and
nitrile group in the blue pigment and aid in identification of
the red pigment, both were analyzed by Raman spectroscopy. The
Raman spectrum contained peaks corresponding to the
Fe^II^-CN-Fe^III^ stretching vibration, Fe-C stretching
vibration, and Fe-CN-Fe deformation vibration (Fig. 8).45
The presence of these peaks confirmed that the blue pigment
was Prussian blue. The red pigment was not identified using
Raman spectroscopy, though the lack of heavy metals from the
XRF analysis suggests an organic red pigment.
Py/GC/MS and µFTIR Analysis of Emulsion and Varnish Layers
Backing samples from four orotones were analyzed via Py/GC/MS
and µFTIR, namely PNWCSC #O2, #O9, #O16, and #O20, and
delaminating orotone PAM 2001.122. The entire layer structure
was analyzed together via Py/GC/MS, while the emulsion layer
was analyzed separately from the varnish layer using µFTIR
spectroscopy (Table 4).
ExpandTable 4Results of Py/GC/MS and μFTIR Analysis of Emulsion and
Varnish layers
Emulsion Layer: Gelatin
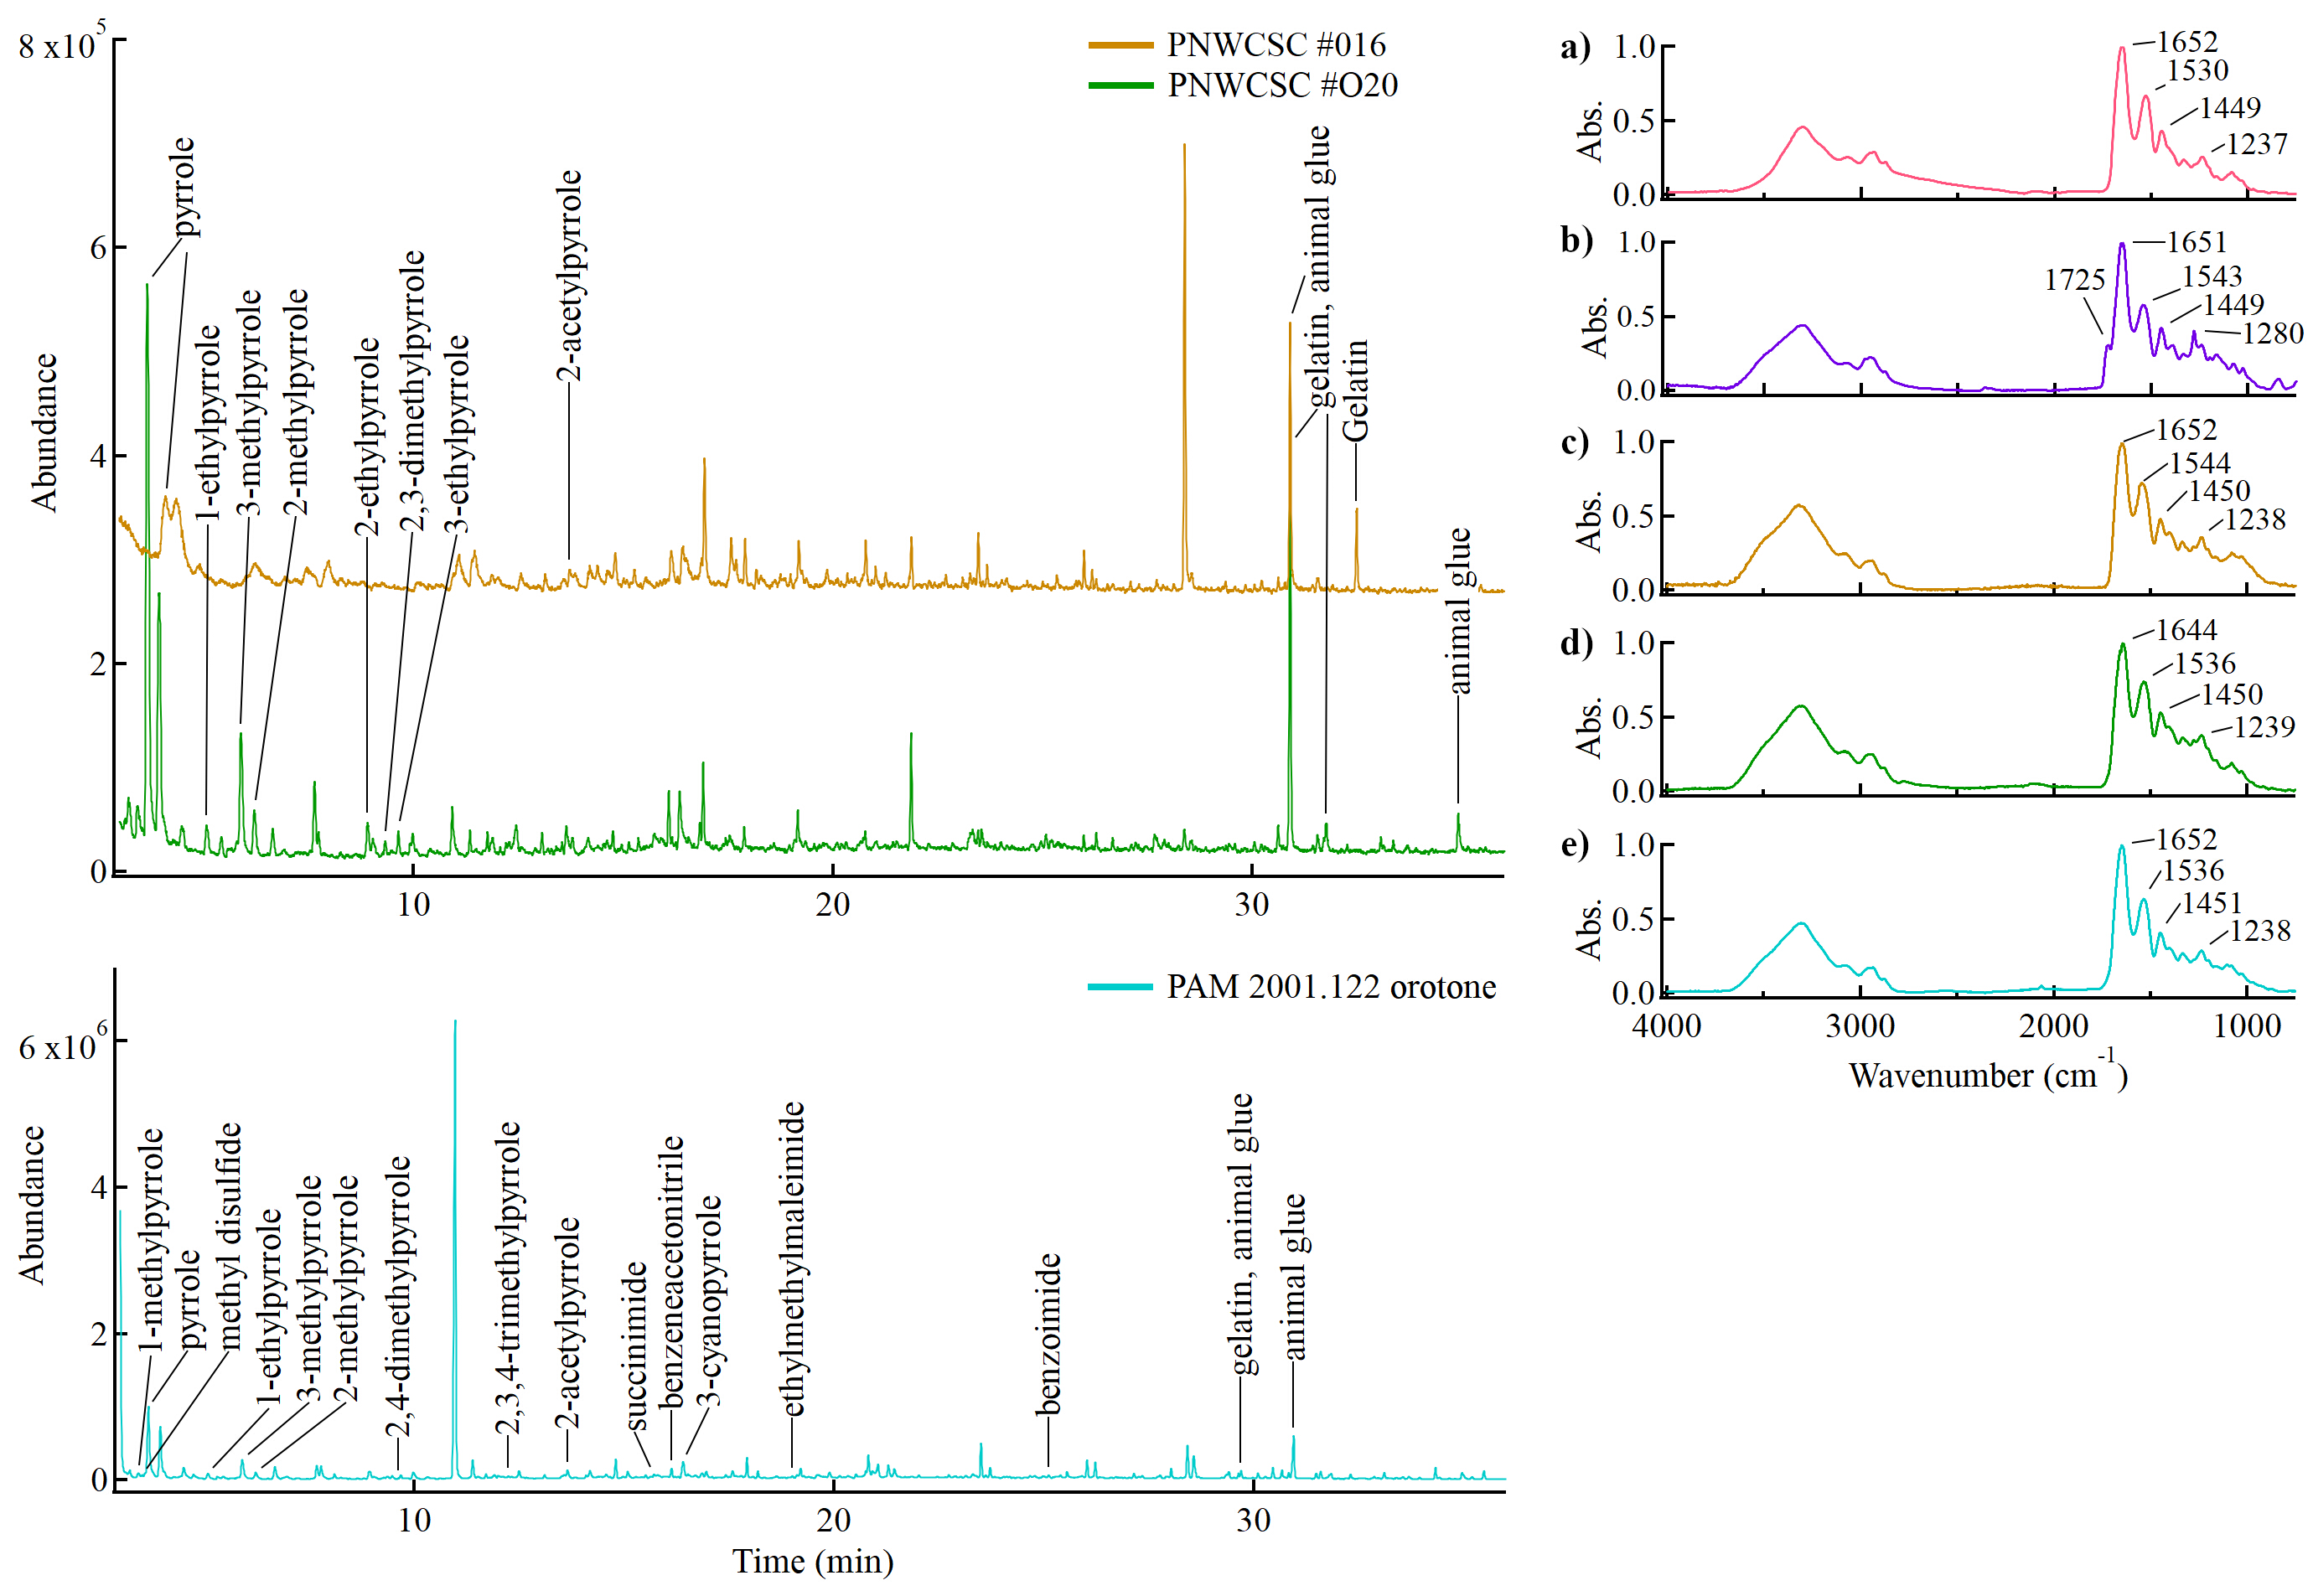
Proteins were detected via Py/GC/MS in samples from PNWCSC
#O16 and #O20 along with PAM 2001.122 (Fig. 9). All samples contained pyrrole and its derivatives along
with unidentified peaks matching mass spectra from gelatin and
animal-glue reference samples. Pyrroles are derived from the
pyrolysis of proline and hydroxyproline, two of the most
abundant amino acids in collagen, the primary component of
gelatin.46
When the emulsion layers from orotones PNWCSC #O2, #O16, and
#O20, as well as PAM 2001.122, were analyzed using µFTIR
spectroscopy, all contained a strong amide I band near 1645
cm^-1^ and an amide II band near 1543 cm^-1^. The peak at 1450
cm^-1^ corresponds to the δ(CH~2~) and δ(CH~3~) absorptions
and the peaks from 1280–1233 cm^-1^ correspond to the amide
III band (Fig. 9b–e). All peaks result from a
protein backbone as shown in the reference protein spectrum
(Fig. 9a), indicating the emulsion layers are
proteinaceous and likely gelatin. All orotones which were
found to contain gelatin emulsions date from the early
twentieth century, further supporting the conclusion that the
gelatin dry-plate process was used in their production.
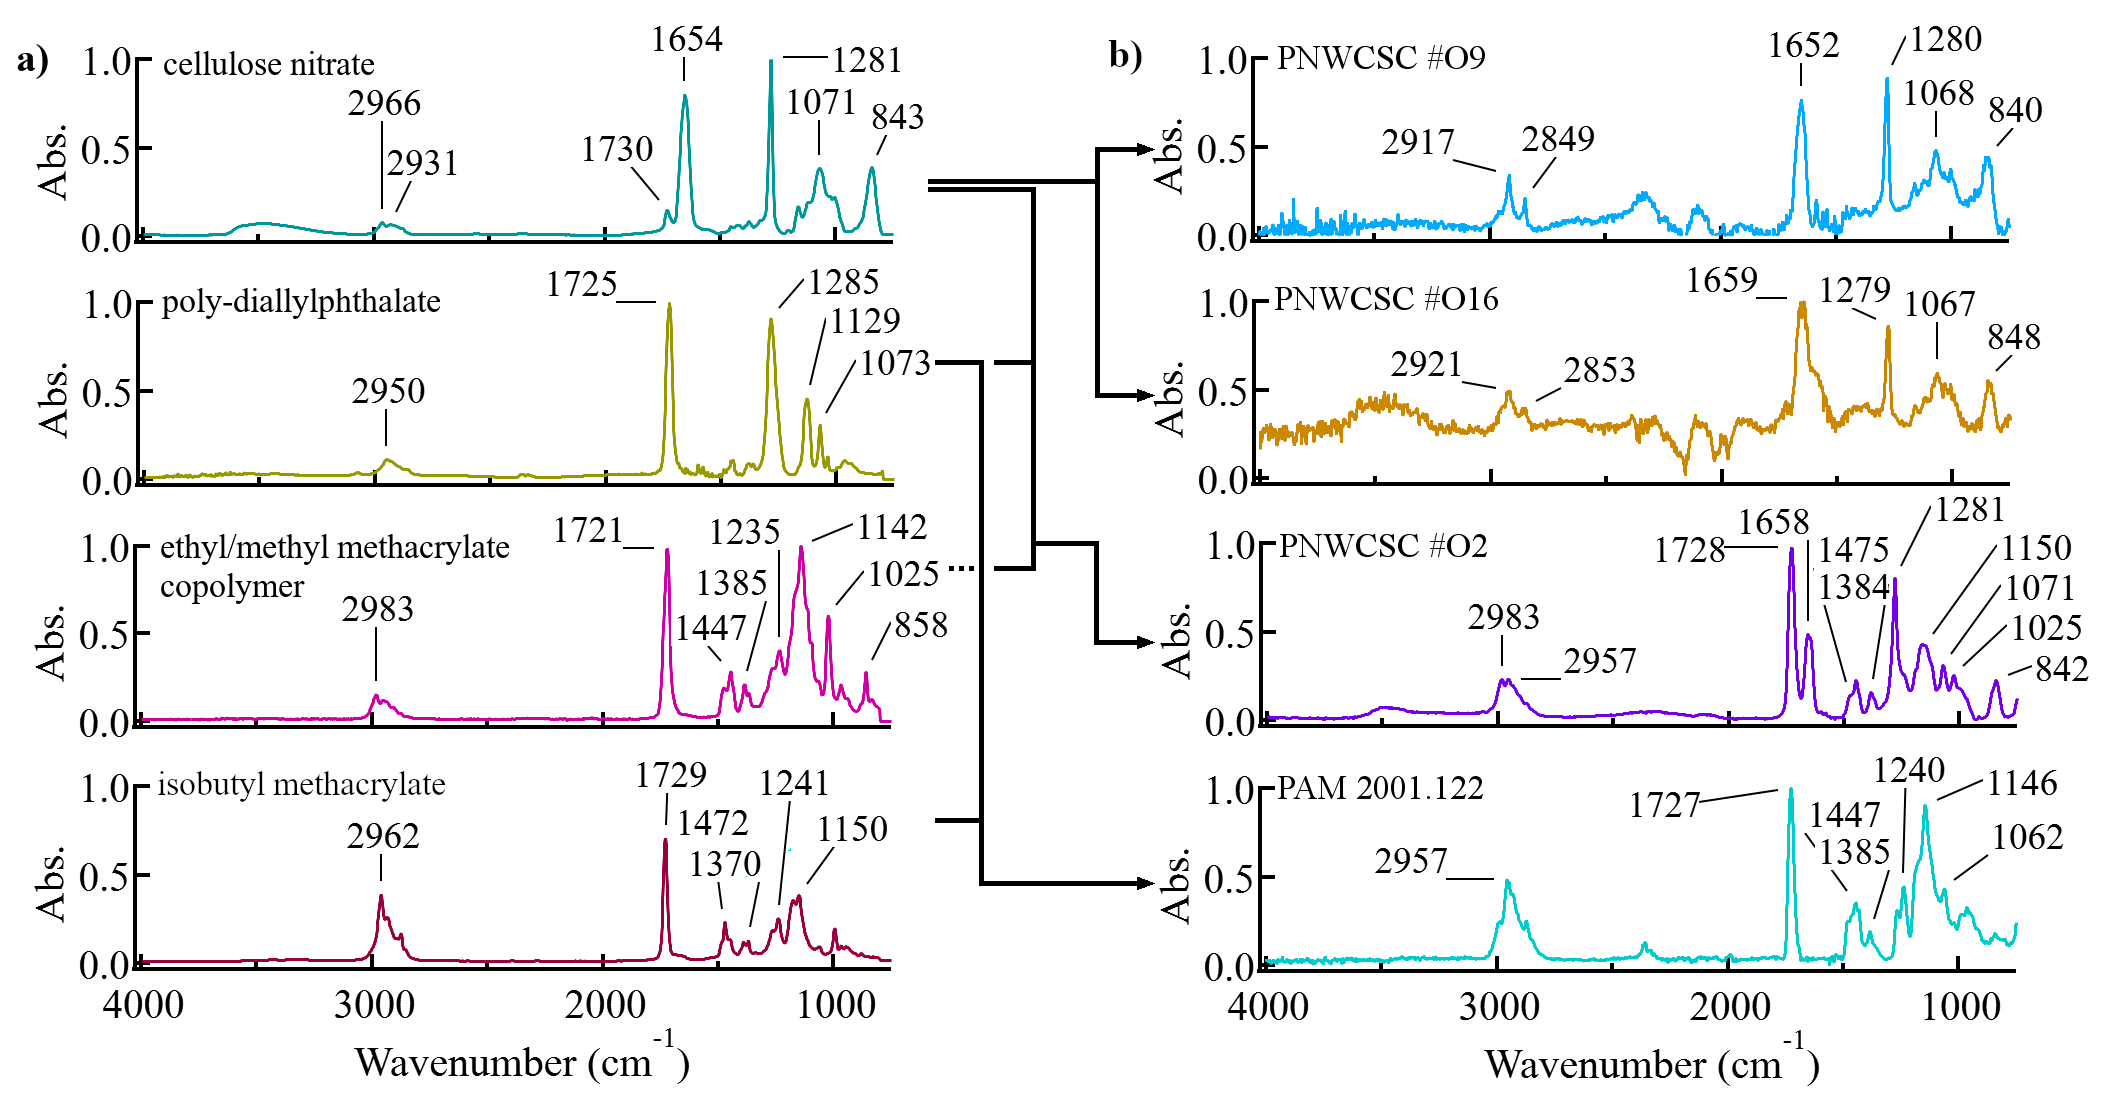
Varnish Layer: Cellulose Nitrate
A few microsamples were taken for µFTIR spectroscopic analysis
to gain insight into the varnish layers. Cellulose nitrate was
identified in the varnish layers of PNWCSC #O2, #O9, and #O16,
while the varnish layer of PNWCSC #O2 also contained a
polymethacrylate polymer and phthalate plasticizers (Fig. 10), which is further discussed in the next section. The
presence of cellulose nitrate was verified by the nitrate
vibration bands near 1653, 1280, and 840 cm^-1^ as well as a
COC stretching peak at 1070 cm^-1^. A peak at 1725 cm^-1^ in
the spectrum from the PNWCSC #O2 varnish sample corresponds to
camphor, a common plasticizer in cellulose nitrate.47
Camphene, a camphor derivative and common plasticizer in
cellulose nitrate, was detected in PNWCSC #O2 using Py/GC/MS
and µFTIR, though its presence was detected in the emulsion
(not as a component of the vanish layer) using µFTIR
(Fig. 9b).
ExpandFig. 9
Left: Py/GC/MS chromatograms of samples from orotones
PNWCSC #O16 and O20 as well as PAM 2001.122 with labeled
peaks relating to pyrroles and pyrrole derivatives,
indicating a gelatin emulsion layer. Right: µFTIR spectra
of a) reference protein spectrum (of hide glue, a protein
similar to gelatin), from the IRUG database, entry number
IPR00019 b) PNWCSC #O2 (c) PNWCSC #O16 d) PNWCSC #O20 e)
PAM 2001.122.
To further characterize the cellulose nitrate varnish layer,
the degree of substitution (DS) was calculated. This value
indicates the number of hydroxyl groups in the glucose monomer
of cellulose that have been replaced or modified, in this case
by nitrates. The highest DS value for cellulose nitrate is 3,
indicating total substitution; however, most cellulose nitrate
films have a DS value less than 3.48
First, a baseline correction was carried out as described by
Nunes et al.,49
then the ratio of the intensities of the NO~2~ peak at 1662
cm^-1^ to the COC stretching peak at 1070 cm^-1^ was
calculated. The result was then input into the calibration
curve created by Nunes et al. This yielded DS values of 1.59
from orotone PNWCSC #O2, 1.76 from orotone PNWCSC #O16, and
2.19 from orotone PNWCSC #O9. Calculating the DS of an IRUG
database reference sample, a sixty-three-year-old film of
cellulose nitrate, yielded a DS value of 2.09. PNWCSC #O9
(produced in the early 1900s) appears to be most similar to
the aged reference despite being significantly older. It is
also the only orotone of the three that has a dusted-on metal
flake layer. The low DS value of 1.76 determined for orotone
PNWCSC #O16 suggests some nitrate loss. PNWCSC #O2 has the
lowest DS value, indicating it may have undergone degradation
in the form of nitrate loss. Results from Nunes et al. found
that a roll of cellulose nitrate film had a much lower DS
value in the interior of the roll than on the exterior. They
theorized that being so encapsulated by layers of film
prevented off-gassing and loss of nitric acid byproducts,
which were instead retained and caused further chain scission
and embrittlement of the film.50
Perhaps the low DS value for PNWCSC #O2 is related to its
encapsulation by an additional polymethacrylate varnish layer.
The orange-peel surface texture of the orotone indicates that
the polymethacrylate was sprayed on, implying its application
as a protective varnish or flake consolidant. This varnish may
instead have promoted deterioration of the underlying
cellulose nitrate layer by preventing loss of acidic
byproducts.
Varnish Layer: Polymethacrylates and Phthalate Plasticizers
Characterization of methacrylate types via µFTIR suggested
that some combination of ethyl methacrylate, methyl
methacrylate, and butyl methacrylate was utilized in some of
the varnish mixtures. PNWCSC #O2 contained a clear phthalate
ester absorption at 1281 cm^-1^, while this peak was present
only as a shoulder in PAM 2001.122. Both spectra contained a
strong carbonyl peak from 1720-1730 cm^-1^ characteristic of
methacrylate polymers. Positions of the C-H stretching
vibrations matched those reported for ethyl/methyl
methacrylate copolymers in the case of PNWCSC #O2 and
poly-isobutyl-methacrylates in PAM 2001.122 (Fig. 10).51
PAM 2001.122 was the singular orotone in which cellulose
nitrate was not detected in any of its layers.
ExpandFig. 10µFTIR spectra of a) reference spectra for cellulose
nitrate (from IRUG database, entry number ISR00065),
poly-diallyl phthalate (IRUG entry number ISR00100), an
ethyl/methyl methacrylate copolymer (IRUG entry number
ISR00142) and isobutyl methacrylate (IRUG entry number
ISR00057) b) spectra collected from the varnish layer of
four orotones. The top two varnishes consist only of
cellulose nitrate. The spectrum for PNWCSC
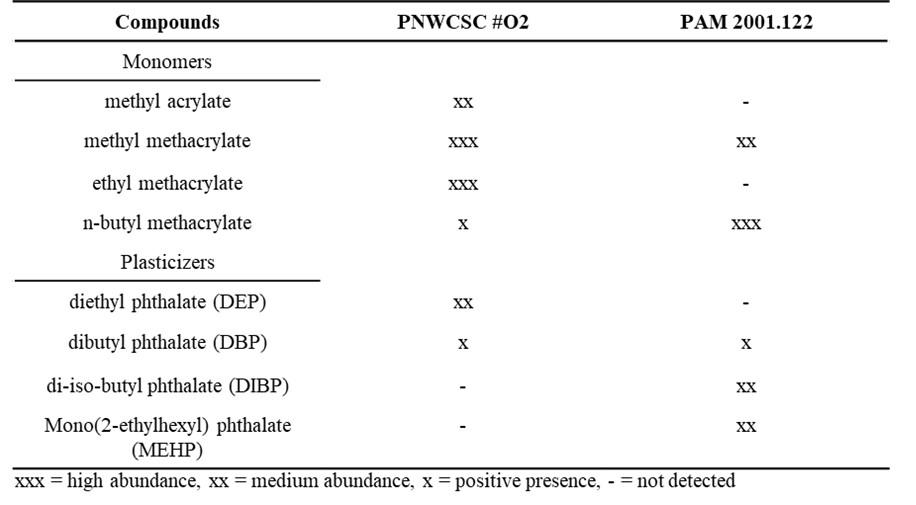
Findings from µFTIR spectroscopy were verified using Py/GC/MS,
with PNWCSC #O2 found to contain majority ethyl methacrylate
while PAM 2001.122 contained majority n-butyl methacrylate.
The relative abundance of methacrylates and phthalate
plasticizers were measured as in Babo et al. (Table 5).52
Both orotones contained a significant methyl methacrylate
component, a common additive to poly-ethyl and poly-butyl
methacrylates, which when used as a copolymer dramatically
improves the stability of the polymethacrylates.53
Phthalate plasticizers were detected in both orotones, though
they were present in greater amounts in PAM 2001.122,
comprising 20% of the chromatographic peak area when compared
with the methacrylate peaks, compared with 6% plasticizer peak
areas in PNWCSC #O2.
ExpandTable 5
Composition of Acrylic Varnish including Methacrylate and
Plasticizer Components, Abundances calculated as follows:
Total monomer peak area/peak area of interest, if result
<5 = xxx, 5-15 = xx, 15-100 = x.
The varnish of PNWCSC #O2 appears pristine, and the entire
backing is well adhered to the glass. In contrast, PAM
2001.122 is delaminating from the glass around the edges. The
poly-methacrylate copolymer in PNWCSC #O2 contains a high
percentage of methyl methacrylates, a known plasticizer when
used as a co-polymer. Additionally, its layer structure is
similar to other orotones in this study, differing only in the
application of a polymethacrylate over the cellulose nitrate
varnish. The ratios and types of methacrylates and phthalates
present in PNWCSC #O2 compare well to Paraloid B72, a common
conservation material used for consolidation and coatings. It
would appear that the orotone had been treated, and the
polymethacrylate applied long after the orotone was produced
in order to protect the varnish and metal flake layer from
deterioration.
In contrast, the varnish layer of orotone PAM 2001.122
contains predominantly poly-butyl-methacrylates, a more
hydrophobic polymer prone to oxidation, chain scission,
cross-linking, and embrittlement.54
Cross-linking would have increased the rigidity of the
varnish, while the more hydrophilic gelatin-emulsion layer
would have expanded and contracted over time with changes in
relative humidity. This combination caused the backing to lose
adhesion to the glass surface, resulting in delamination. The
PAM 2001.122 samples collected for analysis were more brittle
than the PNWCSC #O2 samples, further indicating this loss of
plasticity in the varnish layer.
A notable observation about the PAM 2001.122 orotone involves
its assigned date. While the orotone is dated 1903, the
presence of poly-butyl-methacrylate varnish puts this date
into question. The earliest widespread use of poly-butyl
methacrylates such as Acryloid® B67 dates from the 1940s.55
The image itself appears to be an enlargement of the original
photograph in the UW Special Collections (NA610) by Edward
Curtis in which Edmond Meany is shown posing with Chief Joseph
and Red Thunder. The orotone in this study was likely made at
a much later date than 1903, enlarging only the image of Chief
Joseph and using a poly-butyl-methacrylate varnish
contemporary to its creation, leading to subsequent
deterioration and delamination.
Conclusions
This survey of materials from eighteen photographs in the
collection at the University of Washington Libraries and one
orotone from the Portland Art Museum greatly broadens the
available technical knowledge of orotone and silvertone
photographs. All orotones studied contained gelatin emulsions,
indicating they were created using the gelatin dry plate
method. High-intensity silver peaks in XRF spectra taken from
dark image areas compared with low-intensity or absent silver
in light areas confirmed the imaging medium was silver. The
prevalence of bromine, along with evenly distributed elements
associated with silver bromide processing methods such as
potassium and iron, indicated the silver salt used to
sensitize the emulsion was a silver bromide. No evidence of
gold or platinum toning was observed on any of the orotones.
Sulfur toning could not be verified nor excluded.
The metal flake in all orotones contained copper and zinc,
indicating brass was used to impart the characteristic “gold”
tone. The silvertone PNWCSC #O27 was found to contain an
aluminum metal flake. Both methods of metal flake application
to the varnish, either dusted on or mixed in, were identified
visually in the collection of orotones studied.
Low-density values of 2 g/cm^3^ or below coupled with an
abundance of calcium indicated that the glass supports were
commonly available soda-lime-silica glass. A few glass
supports contained minor lead and arsenic components,
additives that improve glass properties during production.
Analysis of pigments from hand-colored orotones indicated the
use of both inorganic and organic pigments. The palette of
inorganic pigments in this set of orotones included cadmium
yellow, vermilion, Prussian blue, and iron-containing
pigments. In addition, chromium yellow was used as a wash to
impart an overall yellow hue to one image.
Py/GC/MS and µFTIR analysis of the orotone varnishes
identified cellulose nitrate in three orotones. PNWCSC #O2 was
found to contain a sprayed-on ethyl methyl methacrylate
varnish over the cellulose nitrate varnish, suggesting a
previous treatment has been carried out. Determining the
degree of substitution for the NO~2~ group in cellulose
nitrate for three orotones and a naturally aged reference
sample indicated that the ethyl-methyl-methacrylate varnish
over PNWCSC #O2 may have accelerated the loss of nitrates by
encapsulating the varnish layer, promoting the retention of
acids formed during degradation processes.
PAM 2001.122 was found to contain no cellulose nitrate
varnish, instead only containing a poly-butyl-methacrylate
coating applied directly to the emulsion layer. The
delamination observed around the edges of the orotone was
attributed to chemical-mechanical changes in the backing that
differentially swelled/de-swelled at the edges. Furthermore,
the image itself was determined to be an enlargement of a
photograph in the University of Washington Special Collections
(NA610). The unusual backing paired with this finding led to
the conclusion that the assigned production date of 1903 is
likely incorrect and should be modified to sometime after the
usage of poly-butyl-methacrylate coatings in the 1940s.
The documentation of materials presented in this collection of
orotones, along with an example of a successful treatment with
the application of an ethyl methyl methacrylate to PNWCSC #O2,
provide previously unpublished information crucial to the
execution of successful treatments of orotones. Given the
vulnerability of dusted-on metal flake to removal by abrasion,
future treatments with a consolidant could prove to be
beneficial to orotones by preventing further loss of flake.
A greater variety of production techniques than previously
published was implied by determining the metal-flake
application methods used in orotones in this study. While
literature indicates that Curtis mixed in his metal flake,
findings in this study indicate that Curtis sometimes used the
dust-on method, while his brother Asahel mixed the brass metal
flake into his varnish. By finding these prominent examples of
the dust-on method in American orotones, an influence by early
pioneers of gold-toned photography such as Hanbeh Mizuno is
implied.
The University Libraries collections are used frequently for
teaching, research, and exhibition; the results from this work
will be integrated into those scholarly activities. Further
studies of orotones could expand upon and illuminate the
relationships between photographers implied by this study and
encourage interest in the medium and its history.
Acknowledgements
This project received funding from the Mellon Foundation. The
authors would like to thank the Preservation Staff at the
University of Washington Libraries (Justin Johnson, Stephanie
Lamson, Kathryn Leonard, and Judith Johnson), Nicolette
Bromberg (Visual Materials Curator, Special Collections), and
Yan Ling Choi (Conservation Intern) for collaborating with us
on this project. Thank you to the Portland Art Museum and
Samantha Springer for providing the orotone samples. We
acknowledge Greg Baty, from the Center for Electron Microscopy
and Nanofabrication at Portland State University, for
analyzing the silvertone sample and Trine Quady for collecting
Raman spectra.
Bibliography
Alinat, Elodie, Nathalie Delaunay, Xavier Archer, Jean-Maurice
Mallet, and Pierre Gareil. “A New Method for the Determination
of the Nitrogen Content of Nitrocellulose Based on the Molar
Ratio of Nitrite-to-Nitrate Ions Released after Alkaline
Hydrolysis.” Journal of hazardous materials 286
(2015): 92–99.
Babo, Sara, Joana Lia Ferreira, Ana Maria Ramos, Anna
Micheluz, Marisa Pamplona, Maria Helena Casimiro, Luís M.
Ferreira, and Maria João Melo. “Characterization and Long-Term
Stability of Historical PMMA: Impact of Additives and Acrylic
Sheet Industrial Production Processes.” Polymers 12,
no. 10 (2020): 2198.
Chiantore, Oscar, Luigi Trossarelli, and Massimo Lazzari.
“Photooxidative Degradation of Acrylic and Methacrylic
Polymers.” Polymer 41, no. 5 (2000): 1657–68.
Christodoulides, Christy. “Forgotten Gold: The Master Prints
of Edward S. Curtis.” In
Double Exposure: Edward S. Curtis, Marianne Nicolson, Tracy
Rector, Will Wilson, edited by Barbara Brotherton and John
Pierce, 30–41. Seattle: Seattle Art Museum, 2018.
Davis, Barbara A.
Edward S. Curtis: The Life and Times of a Shadow
Catcher. San Francisco: Chronicle, 1985.
Ernst, T., T. Berman, J. Buscaglia, T. Eckert‐Lumsdon, C.
Hanlon, K. Olsson, C. Palenik, S. Ryland, T. Trejos, M.
Valadez, and J. R. Almirall. “Signal‐to‐Noise Ratios in
Forensic Glass Analysis by Micro X‐ray Fluorescence
Spectrometry.” X‐Ray Spectrometry 43, no. 1 (2014):
13–21.
Freestone, Ian, and Mavis Bimson. “The Possible Early Use of
Chromium as a Glass Colorant.”
Journal of Glass Studies 45 (January 2003): 183–85.
Gliozzo, Elisabetta. “The Composition of Colourless Glass: A
Review.”
Archaeological and Anthropological Sciences 9, no. 4
(2017): 455–83.
https://doi.org/10.1007/s12520-016-0388-y.
Graves, Carson.
The Elements of Black-and-White Printing: Going beyond
Darkroom Basics. Boston: Focal Press, 2001.
Hiscox, Gardner Dexter.
Fortunes in Formulas, for Home, Farm, and Workshop; the
Modern Authority for Amateur and Professional; Containing
up-to-Date Selected Scientific Formulas, Trade Secrets,
Processes, and Money-Saving Ideas.
New York, Books, Incorporated, 1939.
http://hdl.handle.net/2027/uc1.b4140803.
Jacobson, Ralph, Sidney Ray, Geoffrey G. Attridge, and Norman
Axford.
The Manual of Photography: Photographic and Digital
Imaging. 9th ed. New York: Routledge, 2000.
https://doi.org/10.4324/9780080510965.
Kurkjian, Charles R., and William R. Prindle. “Perspectives on
the History of Glass Composition.”
Journal of the American Ceramic Society 81, no. 4
(1998): 795–813.
https://doi.org/10.1111/j.1151-2916.1998.tb02415.x.
Learner, Tom, and Tate Gallery. “The Use of a Diamond Cell for
the FTIR Characterisation of Paints and Varnishes Available to
Twentieth Century Artists.” In
Postprints: IRUG2 Meeting (1998): 7–20.
Marriage, John, Mabuchi Isamu, and Mike Ware. “The Gold
Photographs of Mizuno Hanbeh.”
Photographica World 122, no. 4 (2007): 20–38.
Martin, David Francis, and Nicolette Bromberg.
Shadows of a Fleeting World: Pictorial Photography and the
Seattle Camera Club. Seattle: University of Washington Press, 2011.
Moretti, Giulia, and Claire Gervais. “Raman Spectroscopy of
the Photosensitive Pigment Prussian Blue.”
Journal of Raman Spectroscopy 49, no. 7 (2018):
1198–1204.
https://doi.org/10.1002/jrs.5366.
Nunes, Sofia, Francesca Ramacciotti, Artur Neves, Eva Marisole
Angelin,
Ana Maria Ramos, Élia Roldão, Nadja Wallaszkovits, Alfonso
Alejo Armijo, and Maria João Melo. “A Diagnostic Tool for
Assessing the Conservation Condition of Cellulose Nitrate and
Acetate in Heritage Collections: Quantifying the Degree of
Substitution by Infrared Spectroscopy.”
Heritage Science 8, no.1 (2020): 1–14.
O’Connor, Kaslyne, Ariel Pate, Sylvie Pénichon, and Francesca
Casadio. “Moonlight or Midnight? Researching the Phases of
Edward Steichen’s Moonrise Prints.”
Journal of the American Institute for Conservation
59, no. 2 (2020): 111–22.
Orsini, Sibilla, Federica Parlanti, and Ilaria Bonaduce.
“Analytical Pyrolysis of Proteins in Samples from Artistic and
Archaeological Objects.”
Journal of Analytical and Applied Pyrolysis 124
(March 2017): 643–57.
https://doi.org/10.1016/j.jaap.2016.12.017.
Price, Beth A., Boris Pretzel, and Suzanne Quillen Lomax.
“Infrared and Raman Users Groups Spectral Database.” Database.
Infrared and Raman Users Groups Spectral Database, 2009.
http://www.irug.org/search-spectral-database.
Reeves, Tiffany, Rachel S. Popelka-Filcoff, and Claire E.
Lenehan. “Towards Identification of Traditional European and
Indigenous Australian Paint Binders Using Pyrolysis Gas
Chromatography Mass Spectrometry.”
Analytica Chimica Acta, 20th Research and Development
Topics Meeting in Analytical and Environmental Chemistry, 803
(November 2013): 194–203.
https://doi.org/10.1016/j.aca.2013.09.012.
Reilly, James M.
Care and Identification of 19th-Century Photographic
Prints. Rochester, NY: Eastman Kodak, 1986.
Rempel, Siegfried. “Energy Dispersive X-Ray Fluorescence
Applications in the Examination of Historic Photographic
Artifacts.” Paper Conservator 12, no. 1 (1988):
80–85.
https://doi.org/10.1080/03094227.1988.9638565.
Sahyun, M. R. V. “Mechanisms in Photographic Chemistry.”
Journal of Chemical Education 51, no. 2 (1974): 72.
https://doi.org/10.1021/ed051p72.
Sciutto, Giorgia, T. Frizzi, E. Catelli, N. Aresi, S. Prati,
R. Alberti, and R. Mazzeo. “From Macro to Micro: An Advanced
Macro X-ray Fluorescence (MA-XRF) Imaging Approach for the
Study of Painted surfaces.” Microchemical Journal 137
(2018): 277–84.
Sebestyén, Zoltán, Elena Badea, Cristina Carsote, Zsuzsanna
Czégény, Tímea Szabó, Bence Babinszki, János Bozi, and Emma
Jakab. “Characterization of Historical Leather Bookbindings by
Various Thermal Methods (TG/MS, Py-GC/MS, and Micro-DSC) and
FTIR-ATR Spectroscopy,”
Journal of Analytical and Applied Pyrolysis 162
(2022): 105428.
https://doi.org/10.1016/j.jaap.2021.105428.
Shukla, R. P., D. V. Udupa, N. C. Das, and Murty V.
Mantravadi. “Non-destructive Thickness Measurement of
Dichromated Gelatin Films Deposited on GlassPplates.”
Optics & Laser Technology 38, no. 7 (2006):
552–57.
Stenman, Richard. “Initial Investigation into Orotone
Photographs.” Topics in Photographic Preservation 14
(2011): 263–81.
Stulik, Dusan, Herant Khanjian, Alberto de Tagle, and
Alexandra M. Botelho. “Investigation of
Jean-Louis-Marie-Eugene Durieu’s Toning and Varnishing
Experiments: A Non-destructive Approach.” In
ICOM Committee for Conservation, ICOM-CC: 13th Triennial
Meeting, Rio de Janeiro, 22–27 September 2002: Preprints, 2:658–63.
Tani, Tadaaki.
Photographic Sensitivity: Theory and Mechanisms.
Oxford Series in Optical and Imaging Sciences. New York:
Oxford University Press, 1995.
Vila, Anna, and Silvia A. Centeno. “FTIR, Raman and XRF
Identification of the Image Materials in Turn of the 20th
Century Pigment-based Photographs.”
Microchemical Journal 106 (2013): 255–62.
Whitman, Katharine. “History and Conservation of Glass
Supported Photographs.” George Eastman House International
Museum of Photography and Film & Image Permanence
Institute, Rochester Institute of Technology, 2007.
https://drive.google.com/file/d/17R9y0bmD4i_6_pl25t3gF2V0CcAGF1w9/view
Richard Stenman, “Initial Investigation into Orotone
Photographs,”
Topics in Photographic Preservation 14 (2011):
264. ↩︎
Kerry Yates, Shingo Ishikawa, and Mick Newnham,
“Crystalline Deterioration on Glass Cinema Slides,” in
Topics in Photographic Preservation 15 (AIC
& ICOM-CC Photographs Conservation Joint Meeting,
Wellington, New Zealand, 2013), 209–10.
↩︎
Christy Christodoulides, “Forgotten Gold: The Master
Prints of Edward S. Curtis,” in
Double Exposure: Edward S. Curtis, Marianne Nicolson,
Tracy Rector, Will Wilson, ed. Barbara Brotherton and John Pierce (Seattle:
Seattle Art Museum, 2018), 37.
↩︎
Christodoulides, ""32; David F. Martin and
Nicolette Bromberg,
Shadows of a Fleeting World: Pictorial Photography
and the Seattle Camera Club
(Seattle: University of Washington Press, 2011), 1–2;
Lisa Hostetler, “Pictorialism in America,” The Met’s
Heilbrunn Timeline of Art History (2004), accessed June
6, 2023,
https://www.metmuseum.org/toah/hd/pict/hd_pict.htm. ↩︎
Charles R. Kurkjian and William R. Prindle,
“Perspectives on the History of Glass Composition,”
Journal of the American Ceramic Society 81, no.
4 (1998): 802,
https://doi.org/10.1111/j.1151-2916.1998.tb02415.x. ↩︎
Tadaaki Tani,
Photographic Sensitivity: Theory and Mechanisms, Oxford Series in Optical and Imaging Sciences (New
York: Oxford University Press, 1995), 45.
↩︎
Stenman, “Initial Investigation into Orotone
Photographs,” 270–72.
↩︎
R. P. Shukla et al., “Non-Destructive Thickness
Measurement of Dichromated Gelatin Films Deposited on
Glass Plates,” Optics & Laser Technology 38
(2006): 556,
https://doi.org/10.1016/j.optlastec.2004.11.020. ↩︎
E.g., Kaslyne O’Connor et al., “Moonlight or Midnight?
Researching the Phases of Edward Steichen’s Moonrise
Prints,”
Journal of the American Institute for
Conservation
59, no. 2 (2020): 111–22; Anna Vila and Silvia A.
Centeno, “FTIR, Raman and XRF Identification of the
Image Materials in Turn of the 20th Century
Pigment-Based Photographs,”
Microchemical Journal 106 (2013): 255–62,
https://doi.org/10.1016/j.microc.2012.07.016; Stulik, Khanjian, and de Tagle, “Investigation of
Jean-Louis-Marie-Eugene Durieu’s Toning and Varnishing
Experiments: A Non-Destructive Approach,” in
ICOM Committee for Conservation, ICOM-CC: 13th
Triennial Meeting, Rio de Janeiro, 22-27 September
2002: Preprints, 2:658–63; Rempel, “Energy Dispersive X-Ray
Fluorescence Applications.”
↩︎
E.g., G. Sciutto et al., “From Macro to Micro: An
Advanced Macro X-Ray Fluorescence (MA-XRF) Imaging
Approach for the Study of Painted Surfaces / Elsevier
Enhanced Reader,” Microchemical Journal 137
(March 2018): 277–84,
https://doi.org/10.1016/j.microc.2017.11.003; T. Ernst et al., “Signal-to-Noise Ratios in Forensic
Glass Analysis by Micro X-Ray Fluorescence
Spectrometry,” X-Ray Spectrometry 43, no. 1
(2014): 13–21,
https://doi.org/10.1002/xrs.2437. ↩︎
Tiffany Reeves, Rachel S. Popelka-Filcoff, and Claire E.
Lenehan, “Towards Identification of Traditional European
and Indigenous Australian Paint Binders Using Pyrolysis
Gas Chromatography Mass Spectrometry,”
Analytica Chimica Acta 803 (November 25, 2013):
195,
https://doi.org/10.1016/j.aca.2013.09.012. ↩︎
Giulia Moretti and Claire Gervais, “Raman Spectroscopy
of the Photosensitive Pigment Prussian Blue,”
Journal of Raman Spectroscopy 49, no. 7 (2018):
1201–2,
https://doi.org/10.1002/jrs.5366. ↩︎
Zoltán Sebestyén et al., “Characterization of Historical
Leather Bookbindings by Various Thermal Methods (TG/MS,
Py-GC/MS, and Micro-DSC) and FTIR-ATR Spectroscopy,”
Journal of Analytical and Applied Pyrolysis 162
(March 2022): 105428,
https://doi.org/10.1016/j.jaap.2021.105428. ↩︎
Sofia Nunes et al., “A Diagnostic Tool for Assessing the
Conservation Condition of Cellulose Nitrate and Acetate
in Heritage Collections: Quantifying the Degree of
Substitution by Infrared Spectroscopy,”
Heritage Science 8, no. 33 (December 2020): 7,
https://doi.org/10.1186/s40494-020-00373-4. ↩︎
Elodie Alinat et al., “A New Method for the
Determination of the Nitrogen Content of Nitrocellulose
Based on the Molar Ratio of Nitrite-to-Nitrate Ions
Released after Alkaline Hydrolysis / Elsevier Enhanced
Reader,” Journal of Hazardous Materials 286
(2015): 93,
https://doi.org/10.1016/j.jhazmat.2014.12.032. ↩︎
Tom Learner and Tate Gallery, “The Use of a Diamond Cell
for the FTIR Characterisation of Paints and Varnishes
Available to Twentieth Century Artists,” in
Postprints: IRUG2 Meeting, 1998, 11.
↩︎
Sara Babo et al., “Characterization and Long-Term
Stability of Historical PMMA: Impact of Additives and
Acrylic Sheet Industrial Production Processes,”
Polymers 12, no. 2198 (September 25, 2020):
10–11,
https://doi.org/10.3390/polym12102198. ↩︎
Oscar Chiantore, Luigi Trossarelli, and Massimo Lazzari,
“Photooxidative Degradation of Acrylic and Methacrylic
Polymers,” Polymer 41 (2000): 1663,
https://doi.org/10.1016/S0032-3861(99)00349-3. ↩︎
Fig. 2Cross-section of the layer structure of an orotone or
silvertone photograph. The black dots represent silver atom
clusters that form the image. The metal flake can be present
on top of the varnish as shown or mixed into the varnish.
Table 1List of Orotones, Silvertones, and Hand-colored Orotones
Fig. 3a) the backing of PNWCSC #O16 with clear striations
associated with a poured-on varnish with metal flake mixed in
b) the backing of PNWCSC #O18 with a characteristically uneven
density of gold tone typical of a dusted-on metal flake (c) a
microsample from PNWCSC #O2 with metal flake distributed
through the entire varnish, indicating a mixed-in metal flake
d) a microsample from PNWCSC #O18 indicates a dusted-on flake
with its very shiny, friable surface.
Fig. 4The backing of PNWCSC #O9 shows abrasions and loss of flake
in the lower right corner, indicating the flake was dusted on.
This is confirmed by a fragmented and friable microsample of
the backing at 40x magnification.
Table 2XRF spectroscopy results for elements related to the metal
flake, glass, and emulsion. All spectra acquired with red
filter, at 40 kV μA, unless indicated otherwise.
Fig. 5a) Oxygen, b) silicon, (c) sodium, d) calcium, and e)
aluminum SEM/EDS elemental maps collected from the PNWCSC #O27
microsample.
Table 3XRF spectroscopy results for elements related to colorants in
hand-colored orotones
Fig. 6a) PNWCSC #O7 with all test areas labeled and b) the XRF
spectra collected for some of those areas (40 kV, 7.60 μA, 60
sec acquisition time, and 0.001” Cu, 0.001” Ti, and 0.012” Al
filter) with low-energy (top) and high-energy (bottom) insets.
Elements with an asterisk (*) were present from the background
or instrumental artifacts.
Fig. 7a) FTIR spectrum of PNWCSC
Fig. 8Raman spectrum collected from PNWCSC
Table 4Results of Py/GC/MS and μFTIR Analysis of Emulsion and
Varnish layers
Fig. 9
Left: Py/GC/MS chromatograms of samples from orotones PNWCSC
#O16 and O20 as well as PAM 2001.122 with labeled peaks
relating to pyrroles and pyrrole derivatives, indicating a
gelatin emulsion layer. Right: µFTIR spectra of a) reference
protein spectrum (of hide glue, a protein similar to gelatin),
from the IRUG database, entry number IPR00019 b) PNWCSC #O2
(c) PNWCSC #O16 d) PNWCSC #O20 e) PAM 2001.122.
Fig. 10µFTIR spectra of a) reference spectra for cellulose nitrate
(from IRUG database, entry number ISR00065), poly-diallyl
phthalate (IRUG entry number ISR00100), an ethyl/methyl
methacrylate copolymer (IRUG entry number ISR00142) and
isobutyl methacrylate (IRUG entry number ISR00057) b) spectra
collected from the varnish layer of four orotones. The top two
varnishes consist only of cellulose nitrate. The spectrum for
PNWCSC
Table 5
Composition of Acrylic Varnish including Methacrylate and
Plasticizer Components, Abundances calculated as follows:
Total monomer peak area/peak area of interest, if result <5
= xxx, 5-15 = xx, 15-100 = x.